Advanced Technical & Historical Analysis: Merging Price Action with Statistical Reality

In the world of trading, technical analysis is often viewed as a "subjective art." One trader sees a bullish breakout, while another sees an overbought reversal. To eliminate this subjectivity, the Dashboard Options suite includes an advanced Technical & Historical Analysis tool that grounds traditional price action studies in the cold, hard reality of historical data.
Beyond the Lines on a Chart
Traditional technical analysis relies on lagging indicators like Moving Averages, RSI, or MACD. While useful, these indicators lack context. They tell you where the price is, but they don't tell you how the asset has historically behaved when in a similar state.
Our analysis tool bridges this gap by merging three distinct analytical layers into one comprehensive report.
The Three Layers of Analysis
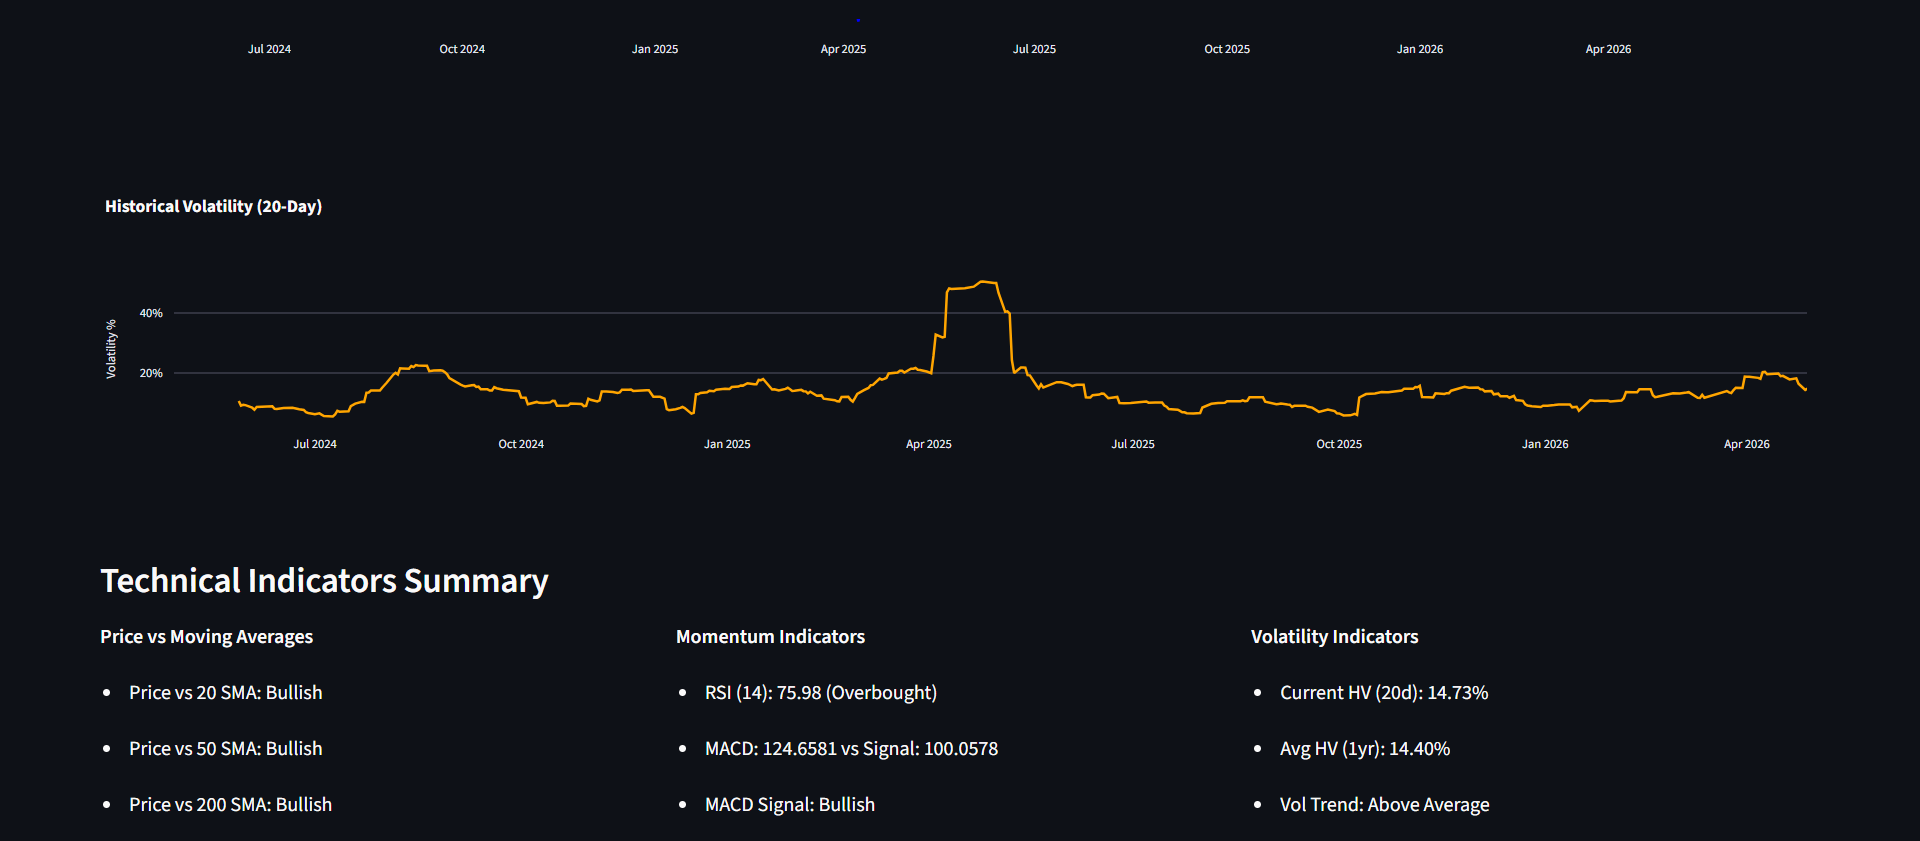
1. Quantitative Technical Summary
Instead of forcing you to check ten different charts, the tool aggregates multiple technical indicators (Trend, Momentum, Volatility) into a single, weighted Technical Analysis Summary. This provides an objective "Regime Identification"—telling you instantly if the current environment is Bullish, Bearish, or Neutral based on a consensus of data.
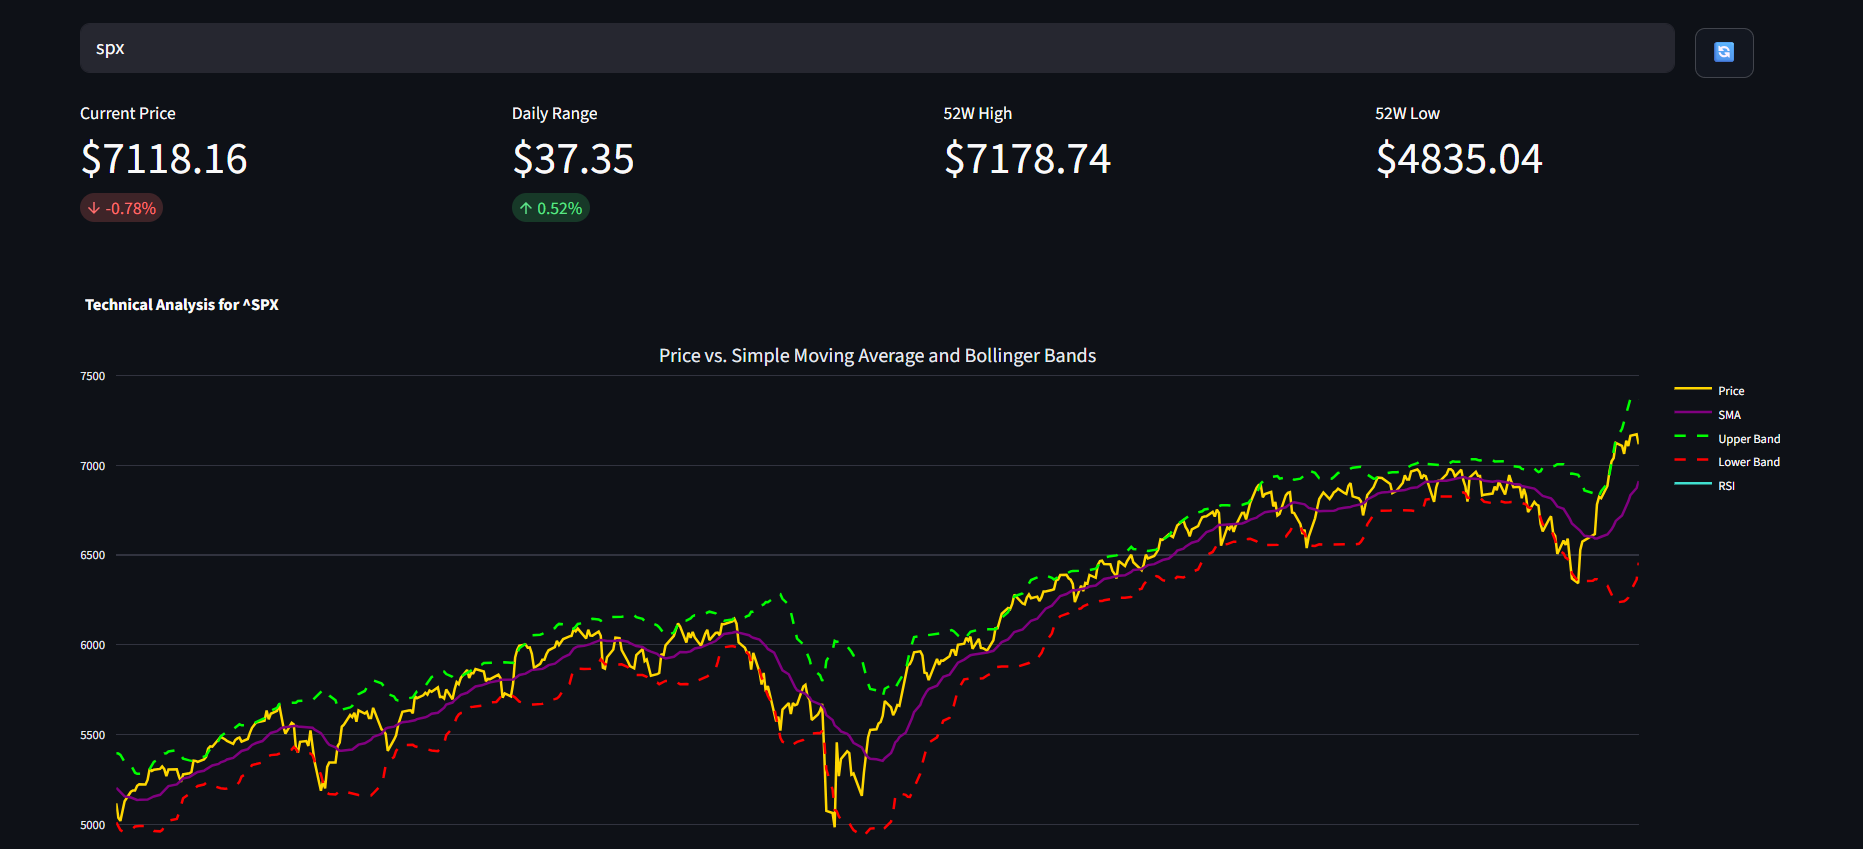
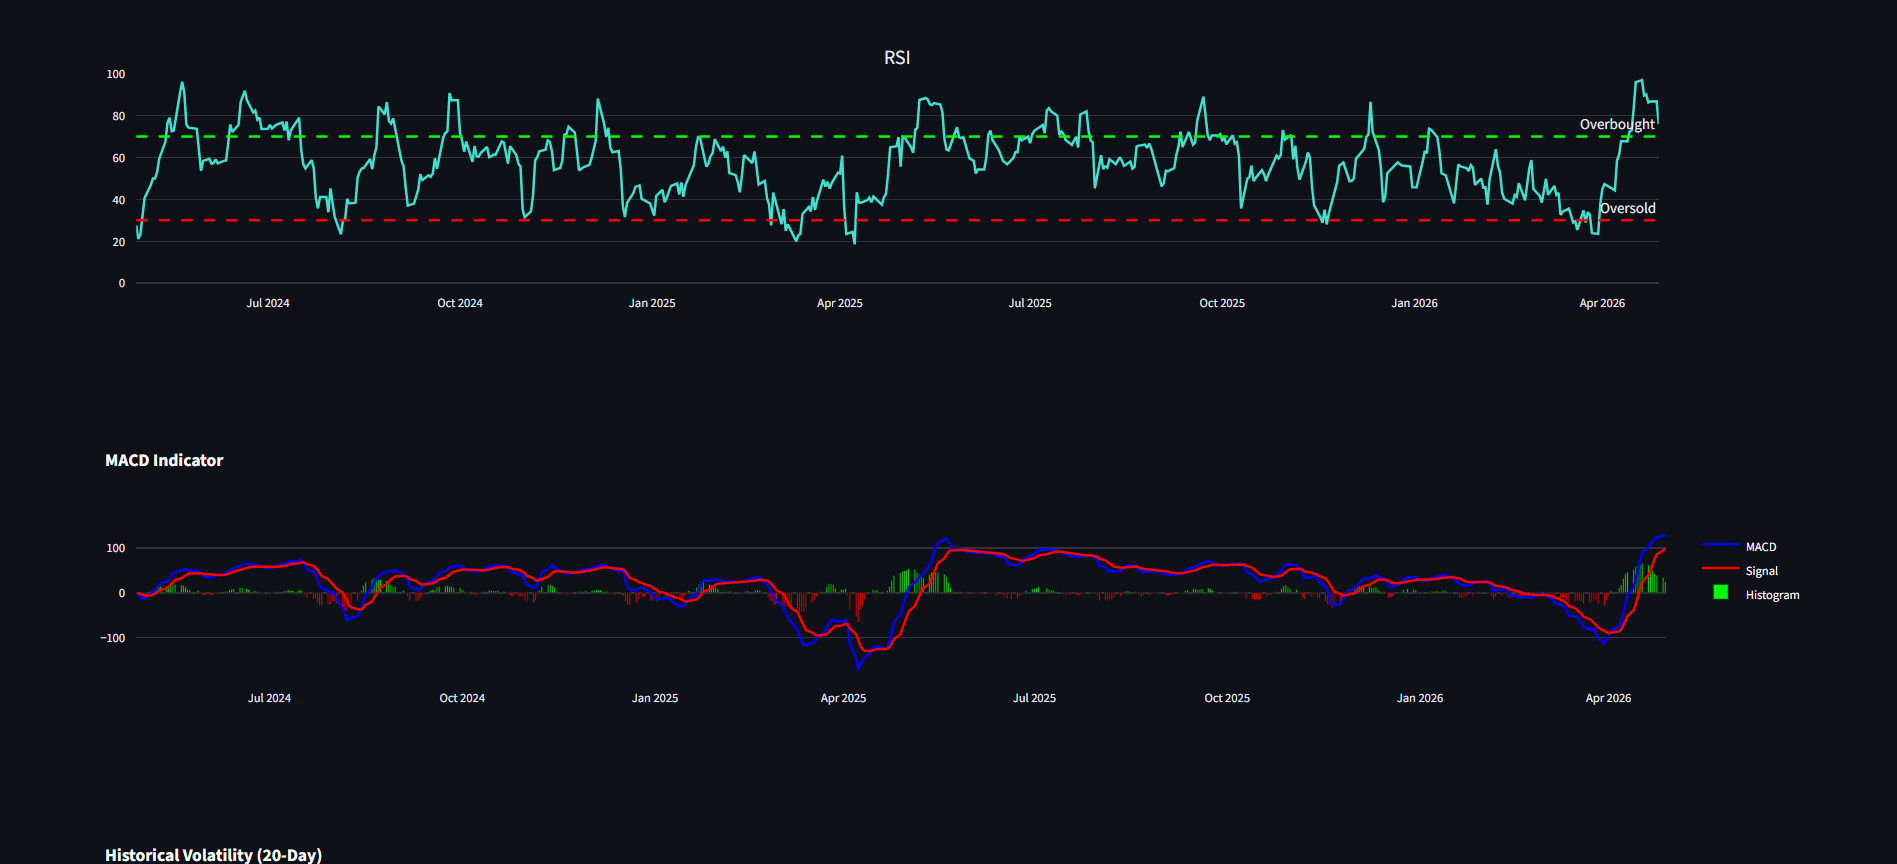 A deep dive into the multi-indicator dashboard, showing the convergence of various technical studies.
2. Historical Returns Analysis
This is where the "Quant" edge comes in. The tool analyzes thousands of past data points to show you the distribution of historical returns. By looking at how the asset has performed in the past, you can determine if a current 2% move is a normal occurrence or a statistical outlier.
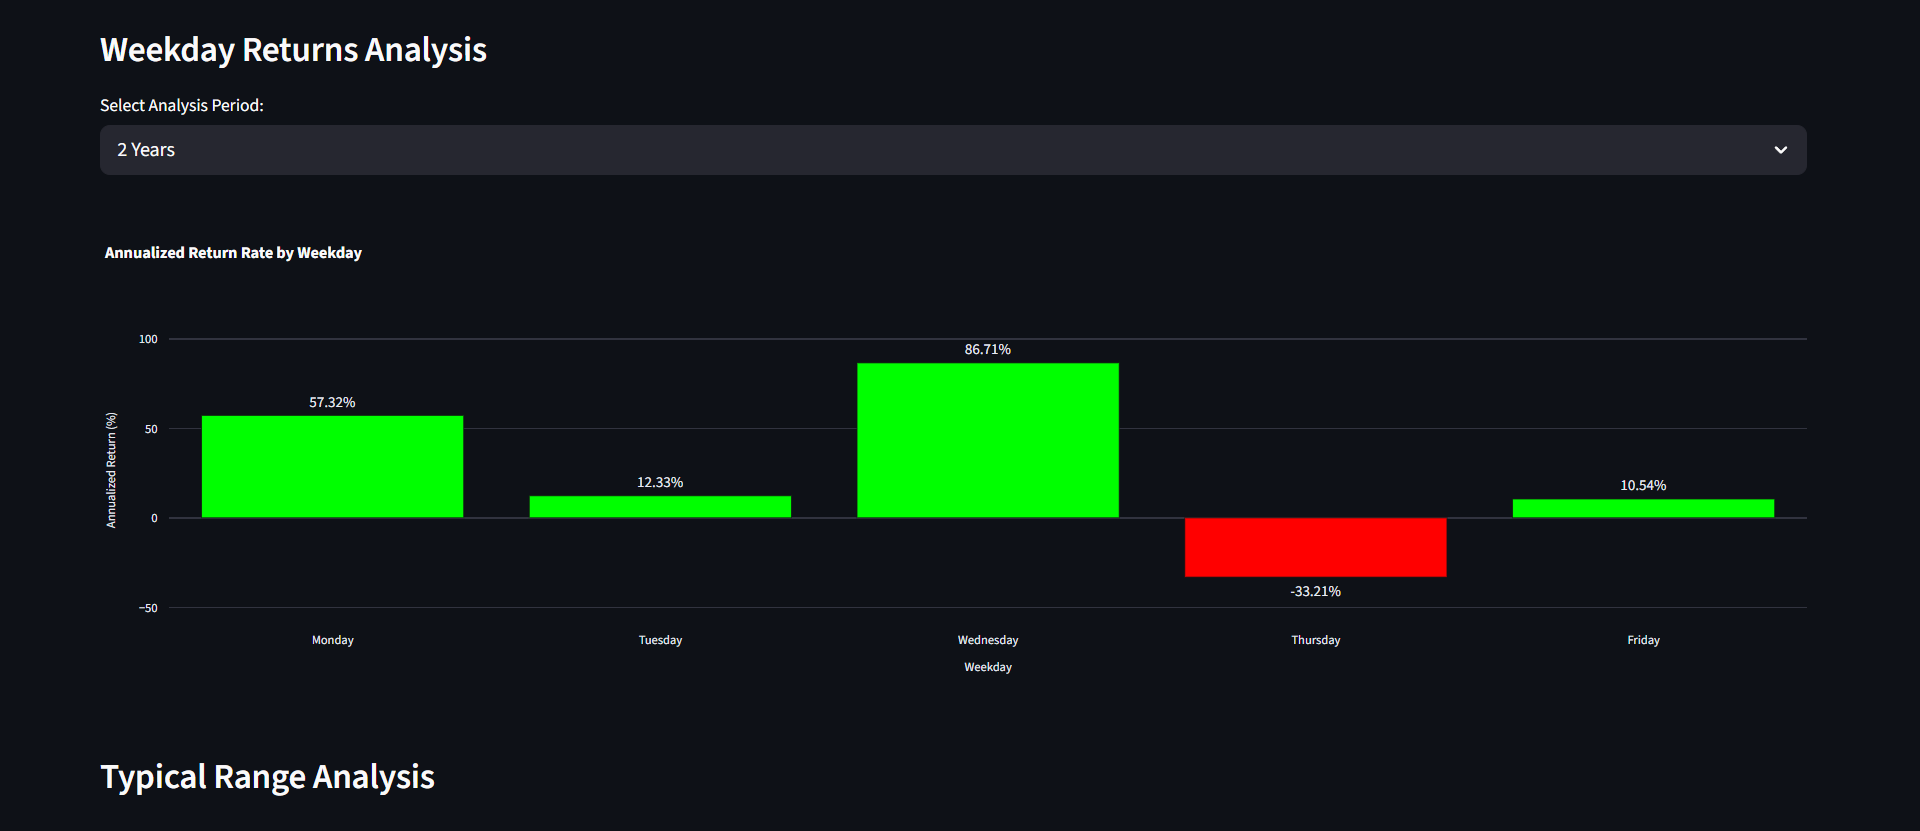 Visualizing the historical performance of the asset to identify the probability of future gains and losses.
3. Typical Range Analysis
Every asset has a "personality"—a typical range of movement that it rarely exceeds. Our tool calculates these Typical Ranges, providing you with a volatility-based "box" for the price. If the price moves outside this typical range, the tool flags it as an "Exhaustion" or "Breakout" event.
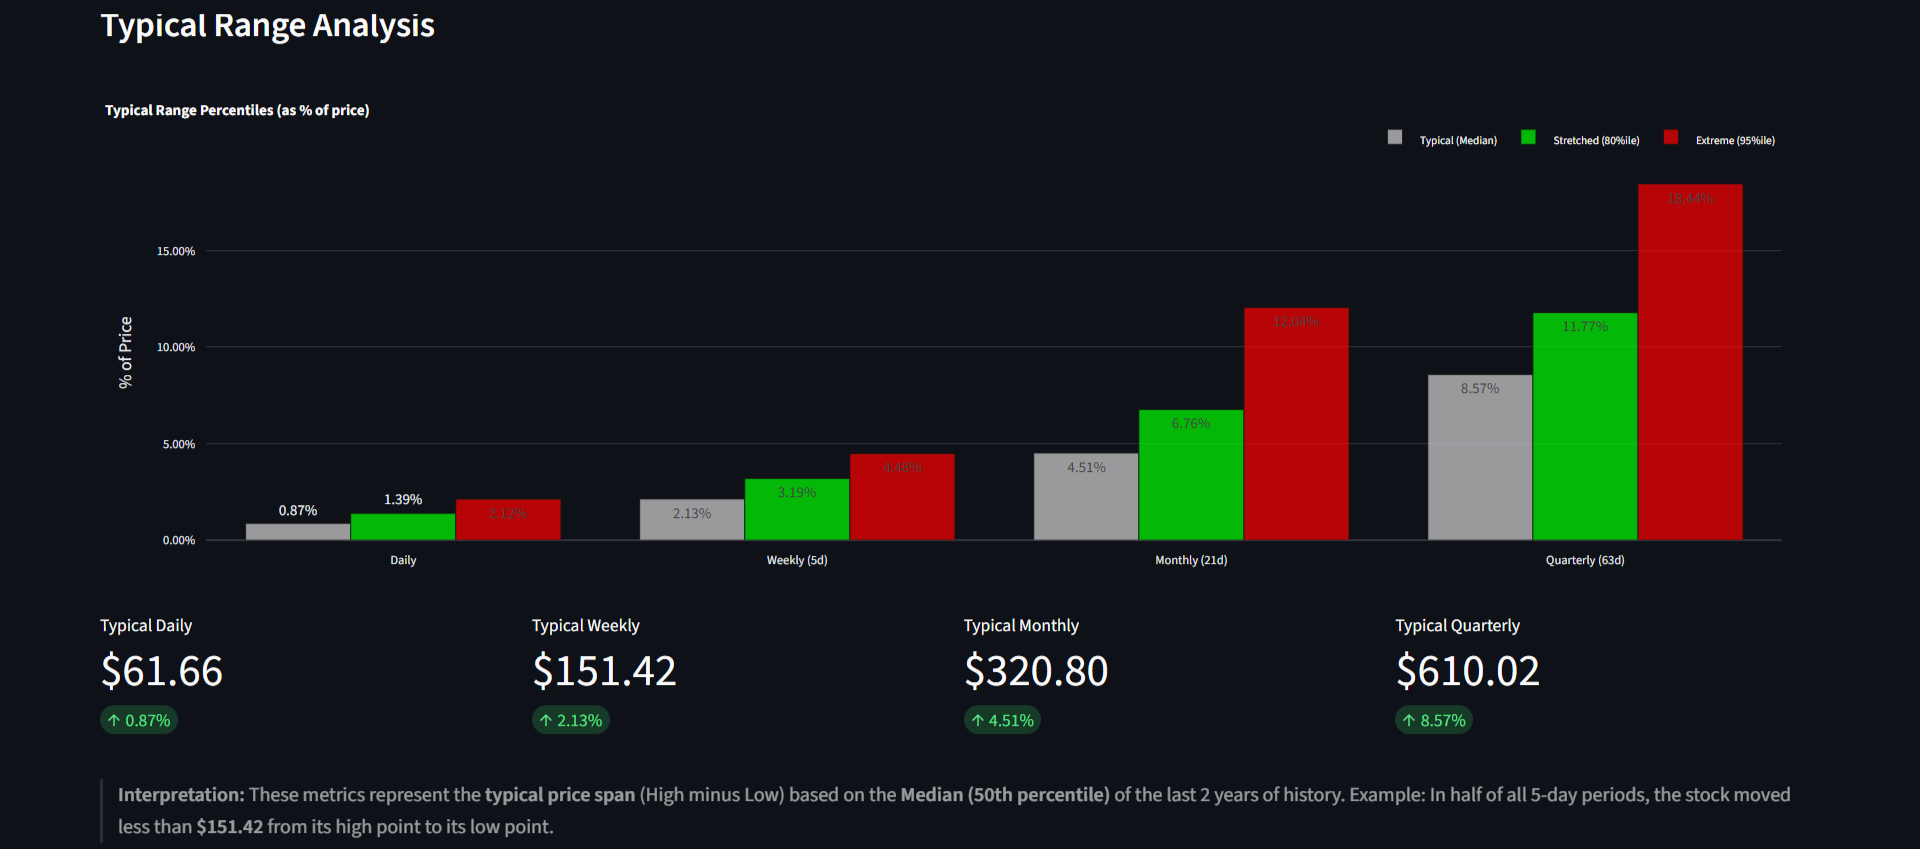 Mapping the 'normal' volatility boundaries to identify overextended price action.
Strategic Edge: Why This Hybrid Approach Works
By combining technical indicators with historical return distributions, you gain a massive advantage:
- Validating Signals: If an RSI shows "Overbought," but the Returns Analysis shows the asset often continues higher in this specific regime, you avoid a false reversal trade.
- Contextualizing Volatility: Typical Range Analysis helps you set profit targets at levels where the price is historically likely to stall, increasing your win rate.
- Objective Decision Making: The Technical Analysis Summary removes the emotional bias of "seeing what you want to see" on the chart.
 The final summarized view, providing a clear directional bias backed by quantitative consensus.
Conclusion: Trading the Present with the Wisdom of the Past
Technical analysis is powerful, but it is incomplete without historical context. The Technical & Historical Analysis tool in Dashboard Options is designed to provide that context. It allows you to trade the current price action while knowing exactly how the "odds" have stacked up in the past.
Don't just trade the chart. Trade the math.
"A technical signal without historical context is just a guess. A technical signal backed by return distribution is a strategy."
Elevate your edge. Explore the Technical & Historical Analysis tool in Dashboard Options today.