Implied Probabilities Analysis: Quantifying Market Expectations and Expected Moves

Every time an option is bought or sold, a prediction is made. The market, through the mechanism of price, is constantly "betting" on the probability of future price levels. Within Dashboard Options, the Implied Probabilities Analysis tool decodes these prices to provide a clear, mathematical view of exactly what the market expects.
Options as a Prediction Market
In standard technical analysis, traders look at past prices to predict the future. In quantitative options analysis, we look at current option premiums to see what the collective market consensus is for future volatility. The Implied Probabilities Analysis tool translates these premiums into actionable probability thresholds.
Key Metrics in the Analysis
1. The Implied Move (Expected Range)
By analyzing the price of "At-the-Money" (ATM) straddles, the tool calculates the Implied Move. This represents the price range within which the market expects the asset to stay by a specific expiration date. Knowing the implied move is the first step in identifying whether a stock is "overextended" or "under-priced."
2. Delta-Based Probability Levels
The tool provides key institutional-grade probability levels:
- 16 Delta (1): The industry standard for one standard deviation. Statistically, there is a 68% probability that the price will stay within these bounds.
- 30 Delta: A common threshold for high-probability institutional credit spreads (approx. 70% probability of staying within range).
3. Market-Implied Probability Distribution
Instead of just looking at numbers, the tool generates a Probability Distribution (Bell Curve). This visualization shows the likelihood of every price point, allowing you to see the "Skew" or "Fat Tails" that indicate market fear or extreme greed.
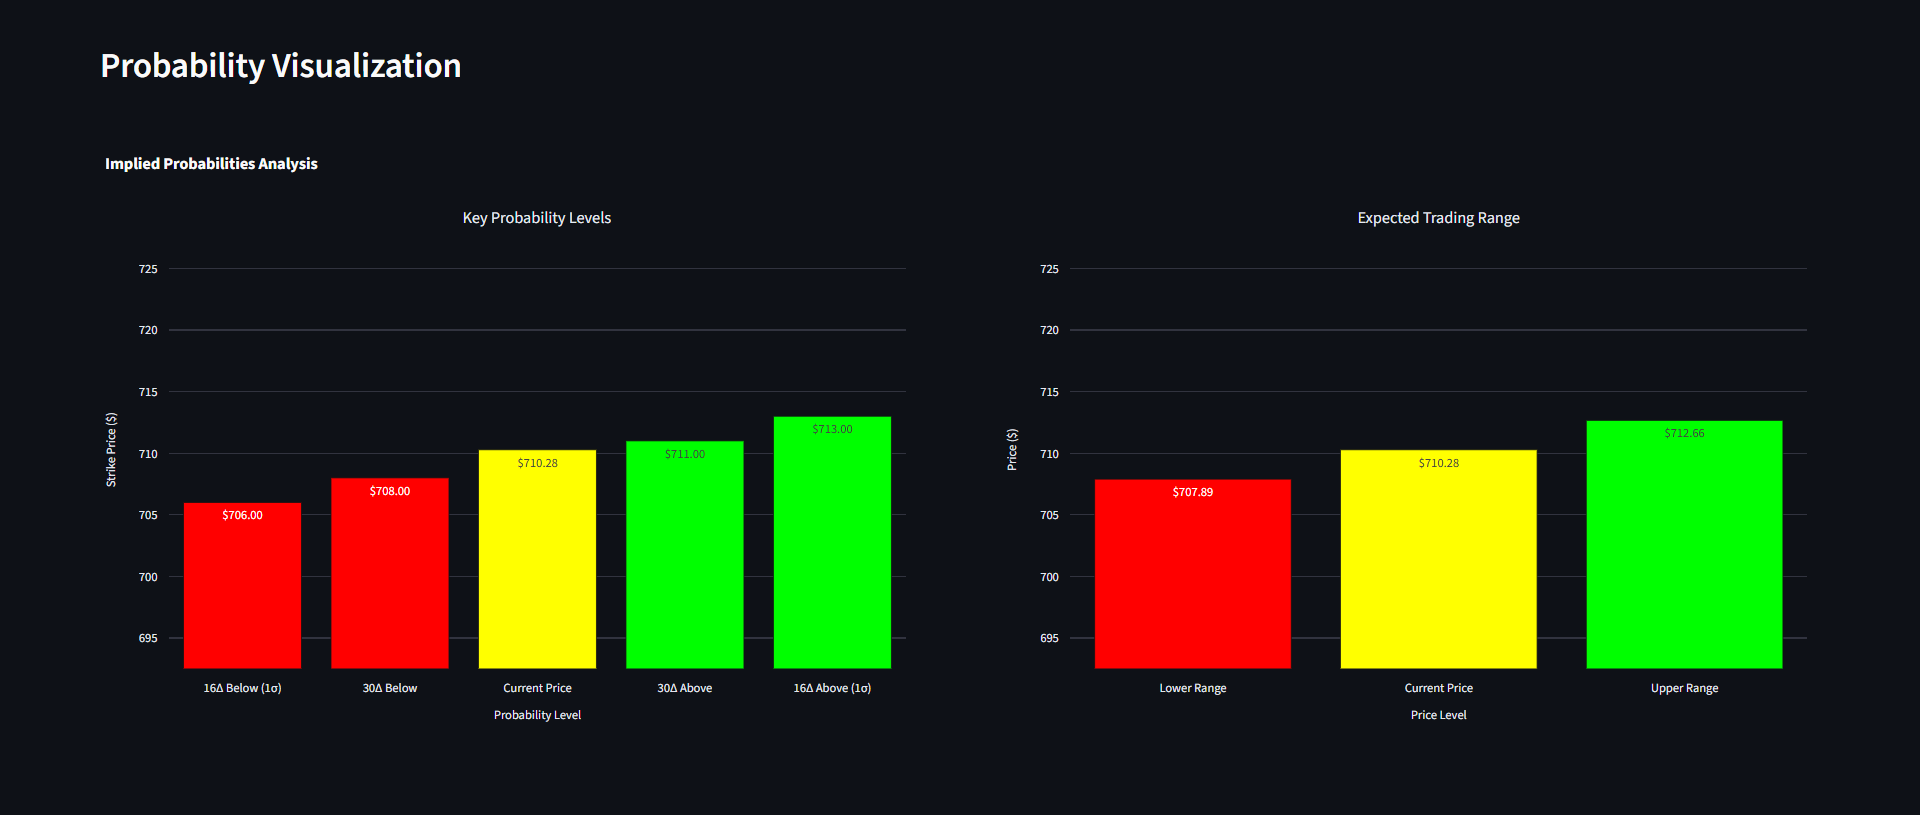 A high-level view of market-implied probabilities, showing expected ranges and standard deviation levels.
A Multi-Page Deep Dive into Risk
The Implied Probabilities Analysis isn't just one chart; it's a comprehensive 4-page report that breaks down every aspect of market expectation:
From Expected Ranges to Support/Resistance
The analysis identifies breakout levels and support/resistance zones not based on "lines on a chart," but on the actual capital at risk in the options market.

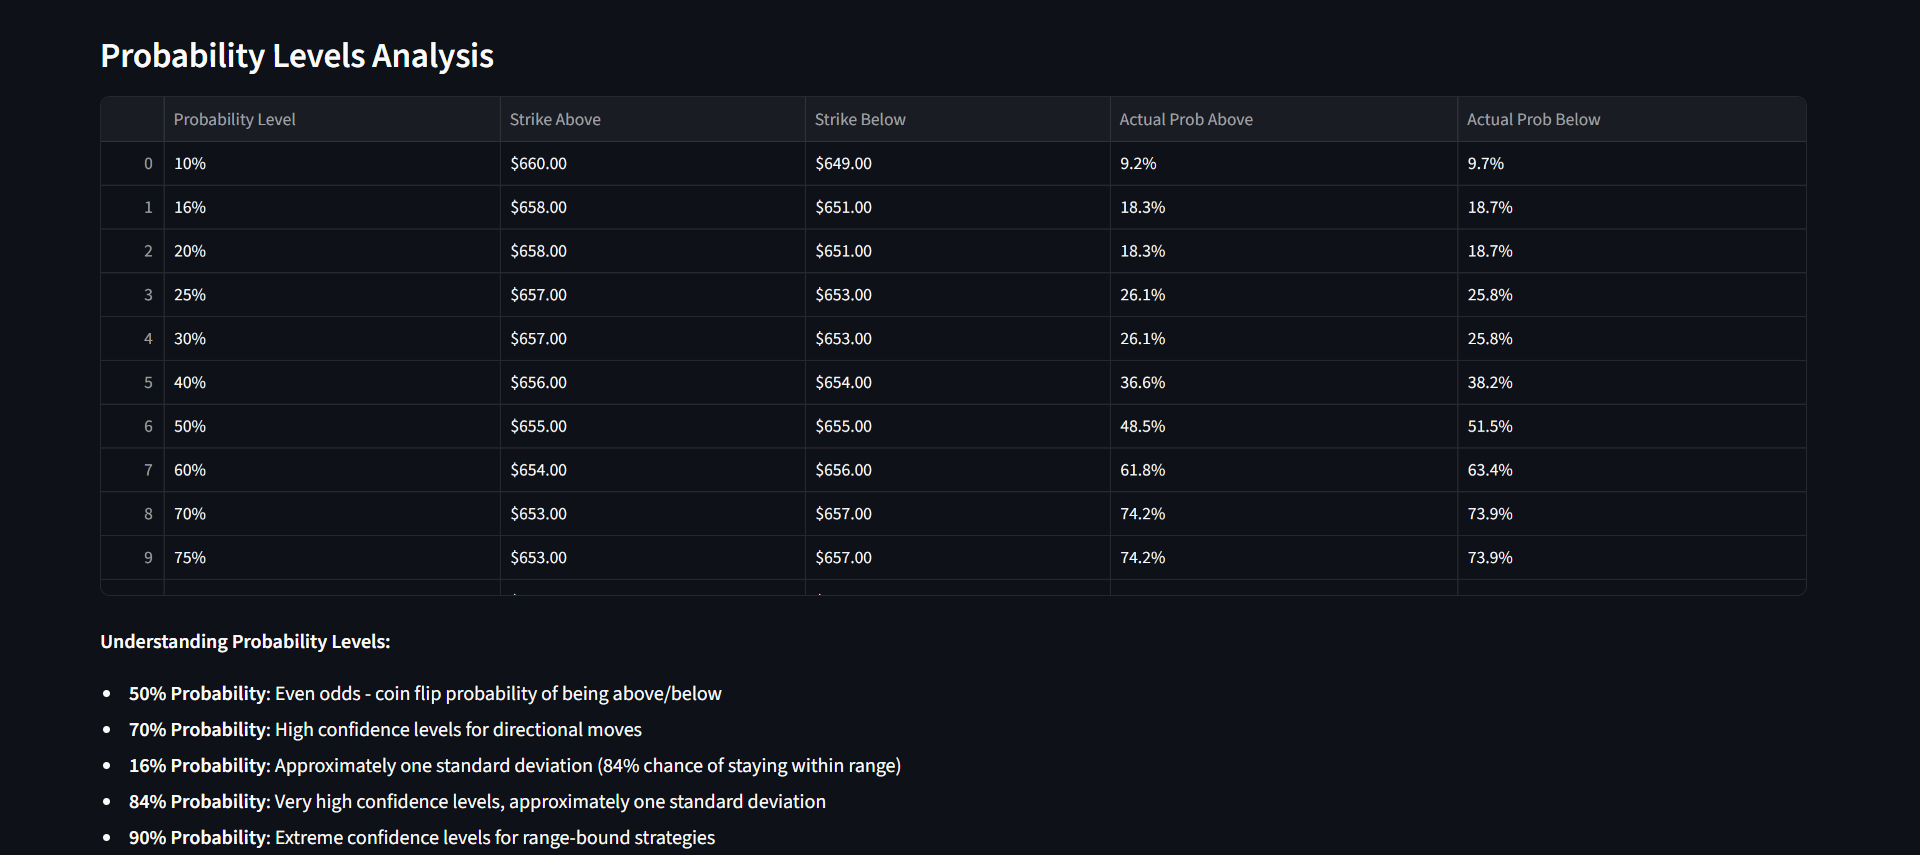 Detailed pages analyzing institutional thresholds and expected volatility regimes.
Visualizing the Statistical Edge
By comparing current price action to these probability zones, traders can identify "statistical edges"—opportunities where the market is pricing in a low probability for an event that the trader believes is more likely, or vice versa.

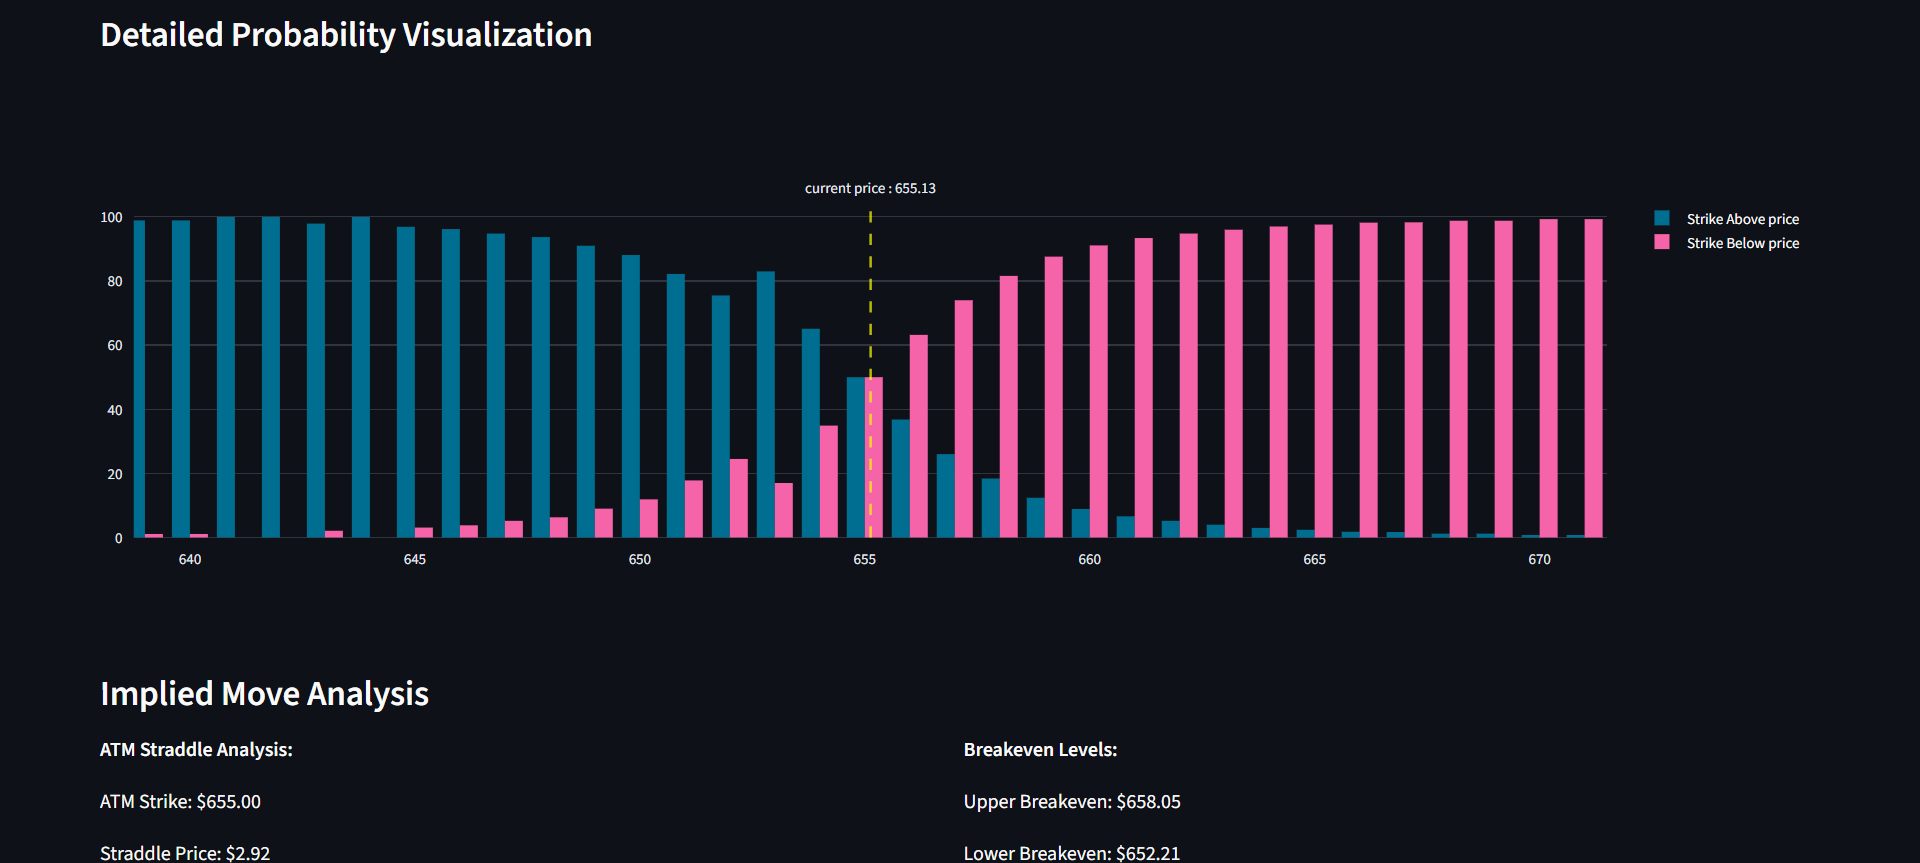 Final analysis pages showing trading ranges and market-implied likelihood of price breakouts.
Conclusion: Trading with Mathematical Certainty
Trading is a game of probabilities. The Implied Probabilities Analysis tool in Dashboard Options removes the guesswork by providing a transparent, quantitative view of the market's internal math.
By understanding where the 1 and 2 levels lie, you can set better profit targets, place more effective stop-losses, and ensure that your risk/reward ratio is always backed by the reality of market pricing.
"Don't guess what the market will do. Read what the market is pricing."
Elevate your strategy with quantitative precision. Explore the Implied Probabilities Analysis tool in Dashboard Options today.