Mastering Market Sentiment: A Deep Dive into OI, Volume, and Institutional Flow

In the fast-paced world of options trading, following the “Smart Money” isn’t just an advantage—it’s a necessity. At Dashboard Options, we’ve built the OI & Volume tool to strip away the noise and reveal where institutional capital is actually moving.
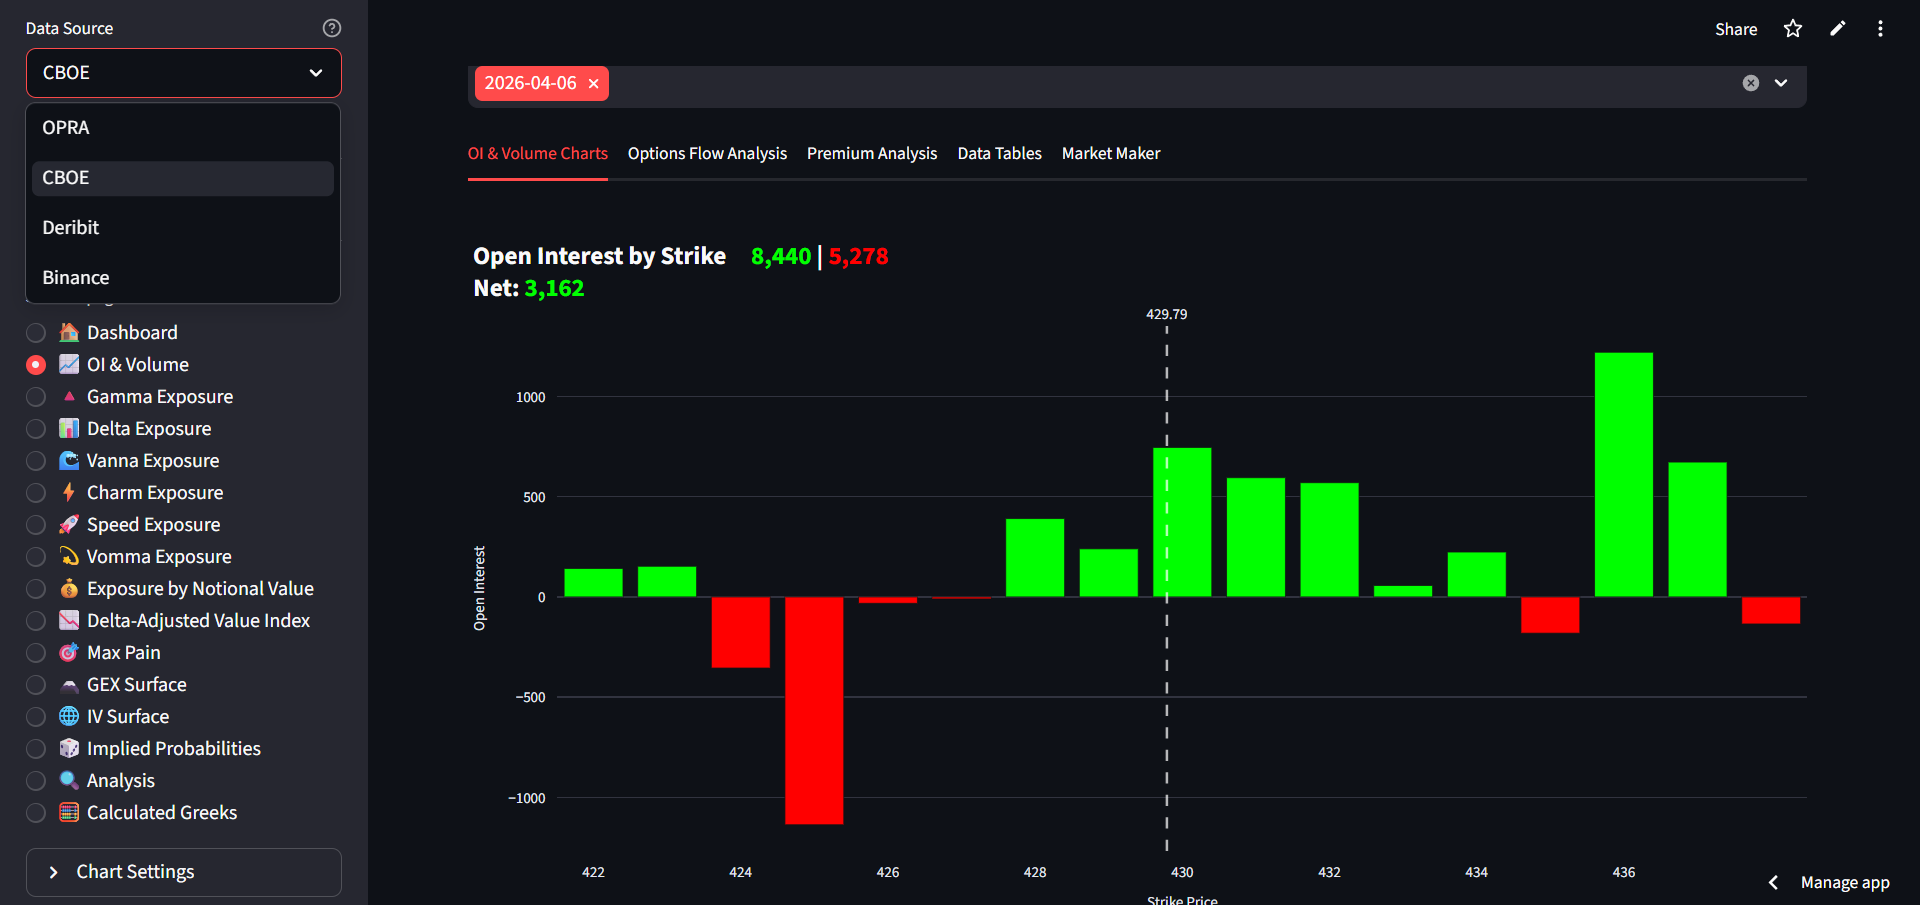
1. OI & Volume: Mapping the Battlefield
Open Interest (OI) tells you where the big bets are parked. Unlike volume, which shows daily activity, OI reveals the total number of outstanding contracts. It’s the map of where the market’s “gravity” sits.
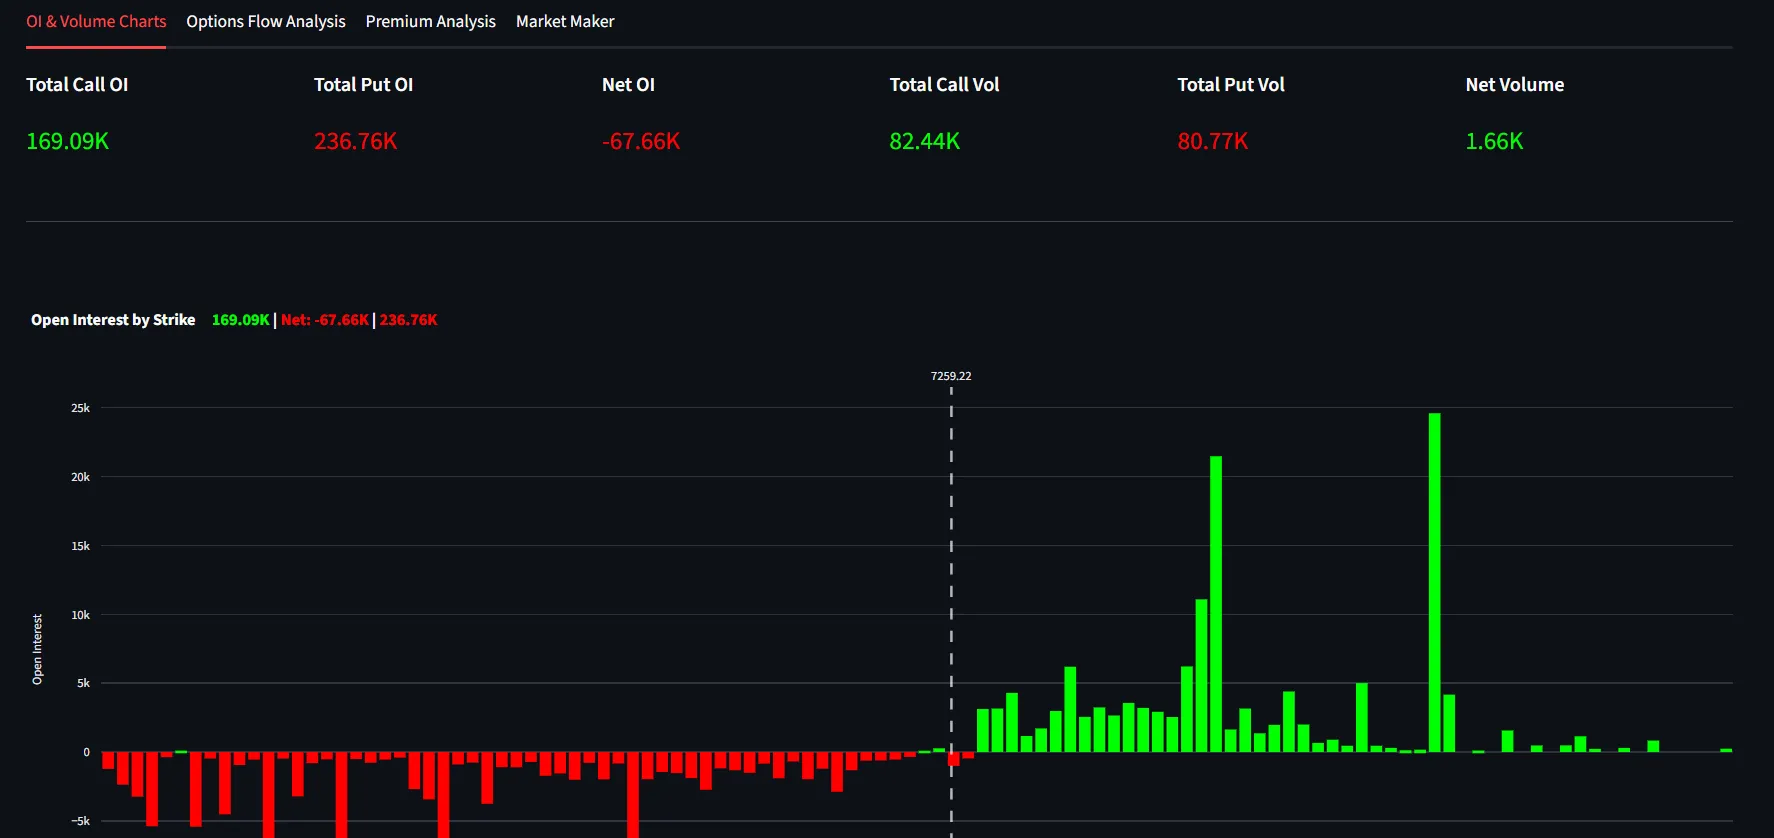
- Total Call/Put OI: We track the absolute build-up of contracts.
- Net OI: This is your first clue to market bias. A massive gap between Calls and Puts often signals a major support or resistance level.
- Strike-Specific Concentration: Our charts show you exactly which price levels the market is “pinning.”
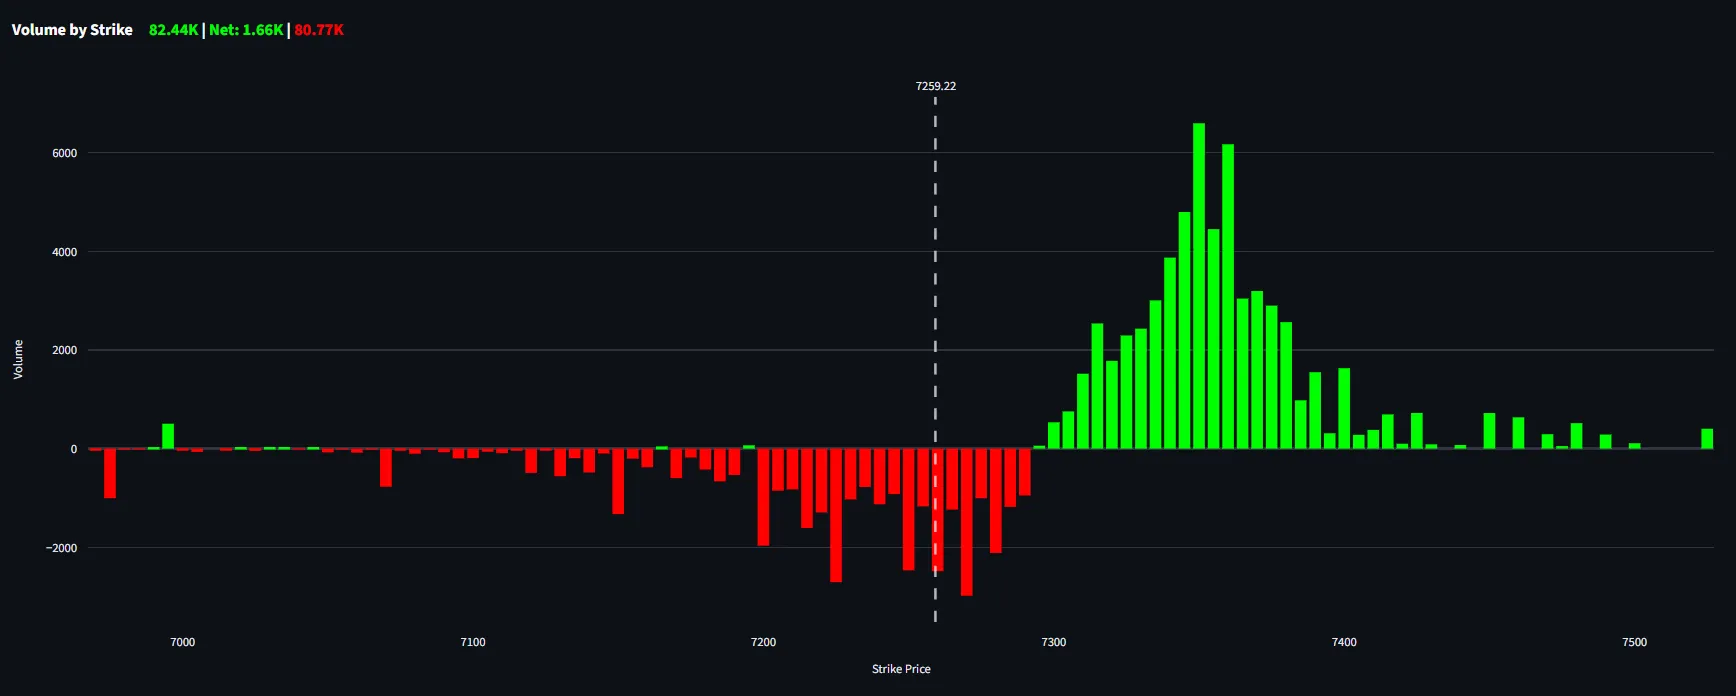
When you see a spike in Volume by Strike (green/red bars) relative to existing OI, it means new positions are being opened or massive hedges are being deployed in real-time.
2. Options Flow Analysis: Real-Time Momentum
While OI is the map, Flow is the current. It represents the actual premium being spent right now.
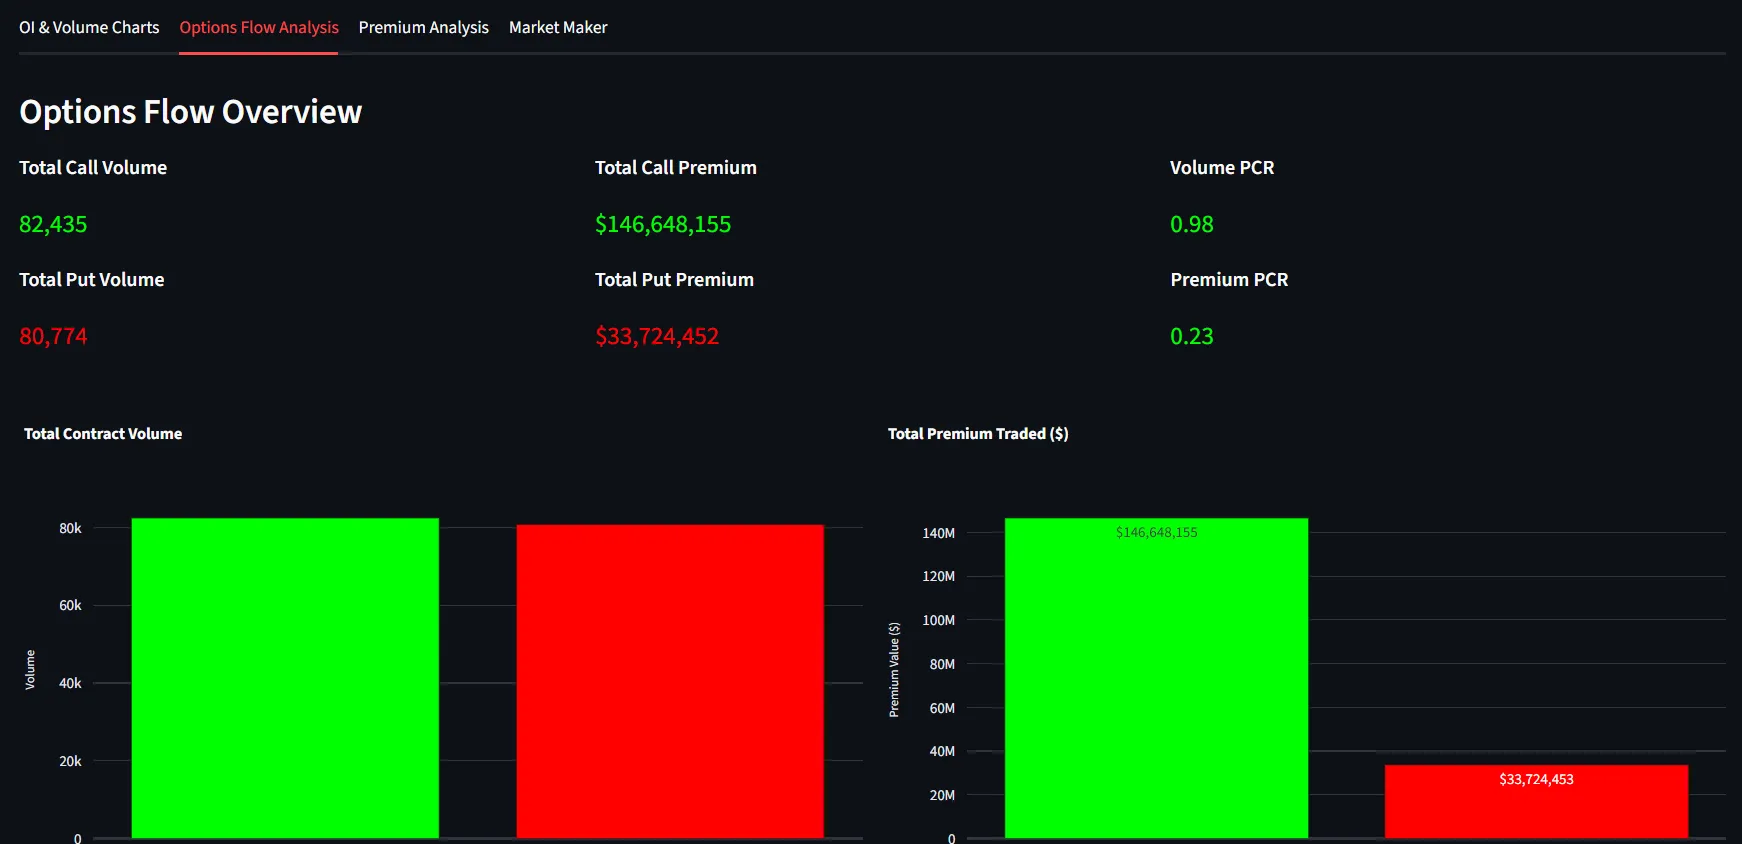
We don’t just look at numbers; we look at the Premium PCR (Put/Call Ratio). If the Call Premium significantly outweighs the Put Premium, it’s a clear sign of aggressive bullish sentiment—even if the contract volume looks balanced.
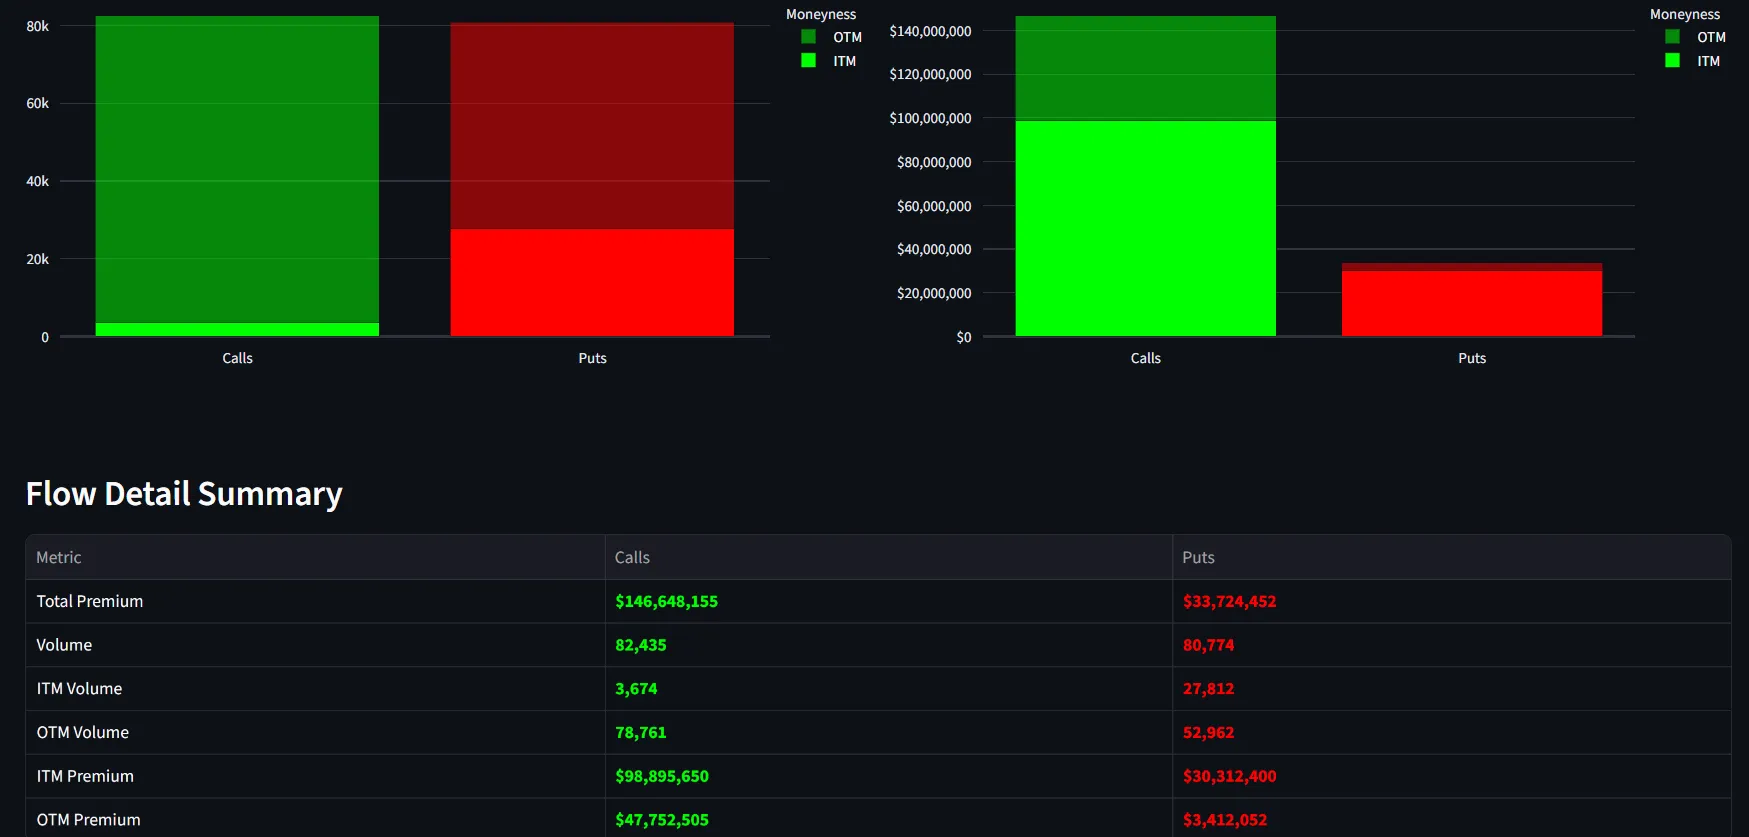
The real alpha is in the Moneyness Breakdown:
- ITM (In-The-Money): This is where institutions typically operate for directional bets.
- OTM (Out-The-Money): High OTM volume often points to speculative “lotto” plays or massive tail-risk hedging.
3. Premium Analysis: Following the Dollars
Trading is about money, not just contracts. A single institutional block trade can carry more weight than thousands of retail orders.
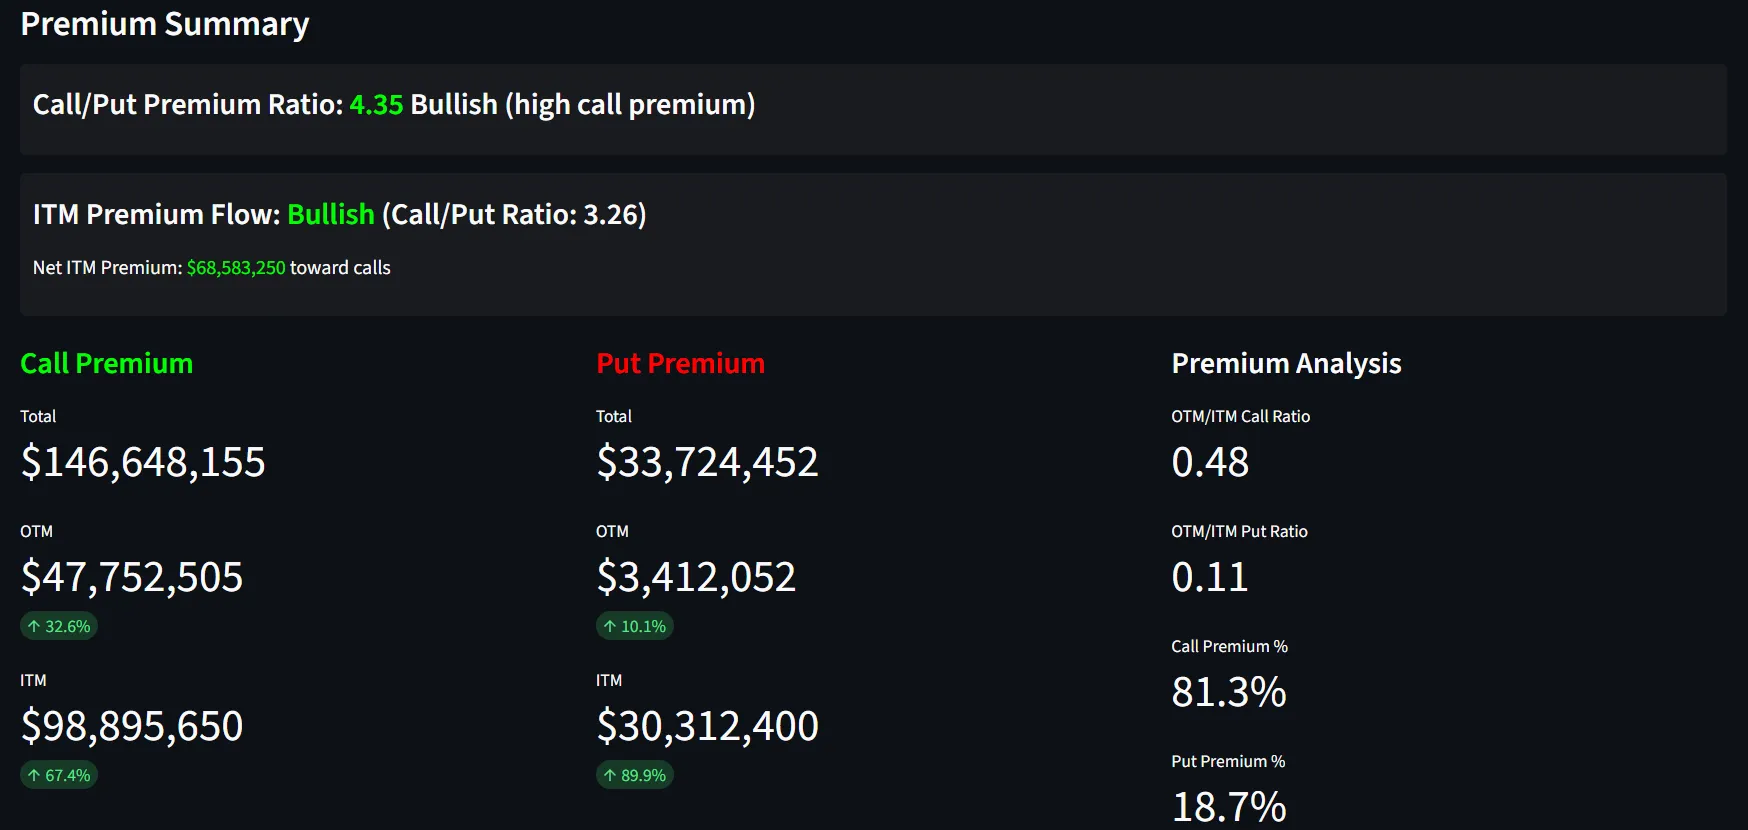
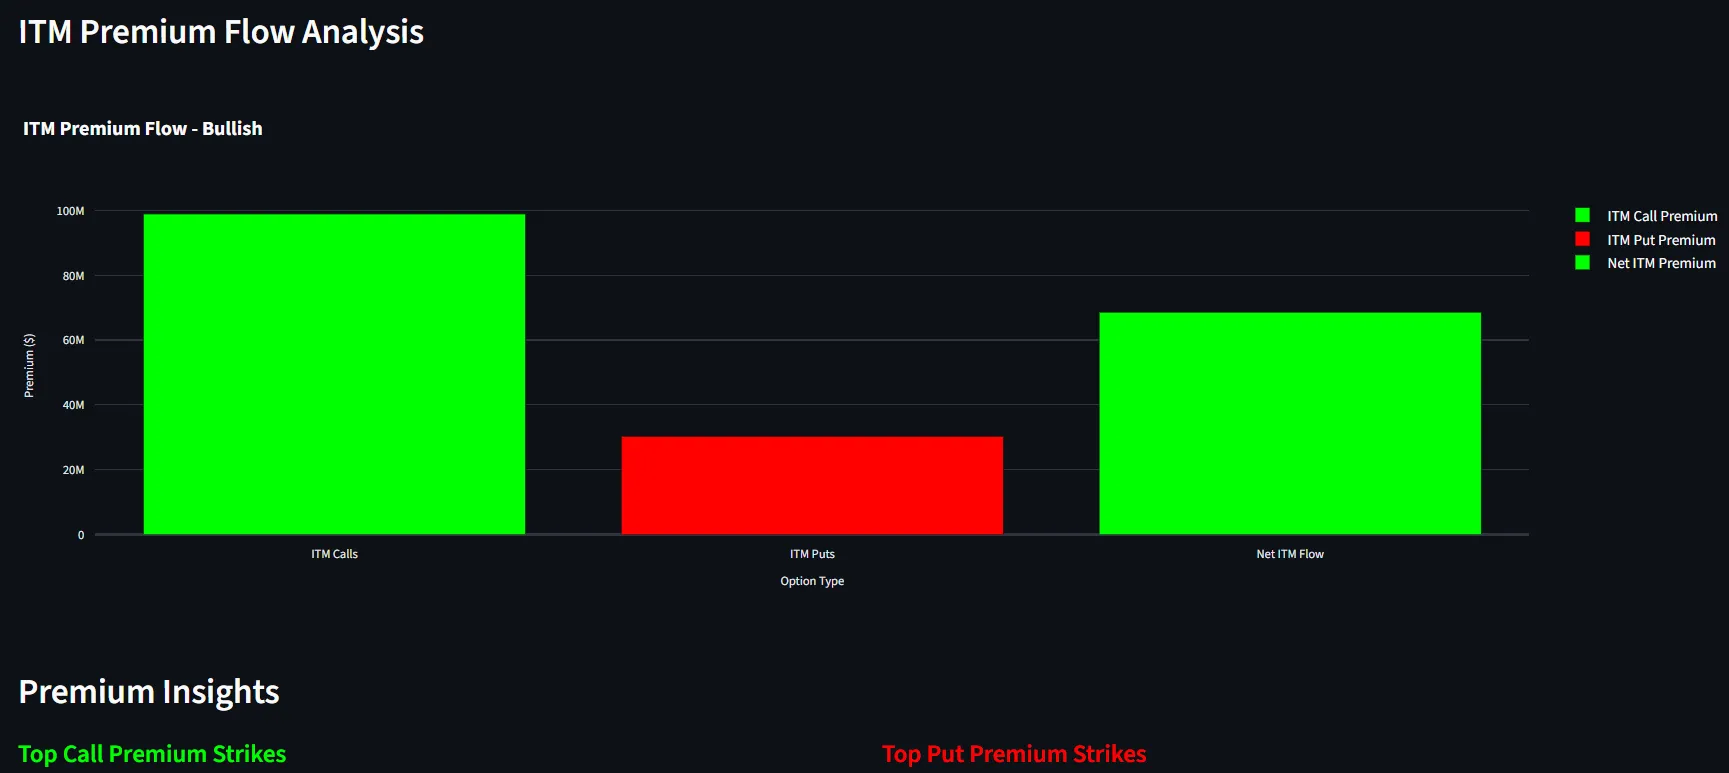
Our Premium Summary simplifies the complex. By looking at the Call/Put Premium Ratio, you get an immediate pulse on whether the flow is “Bullish” or “Bearish.”
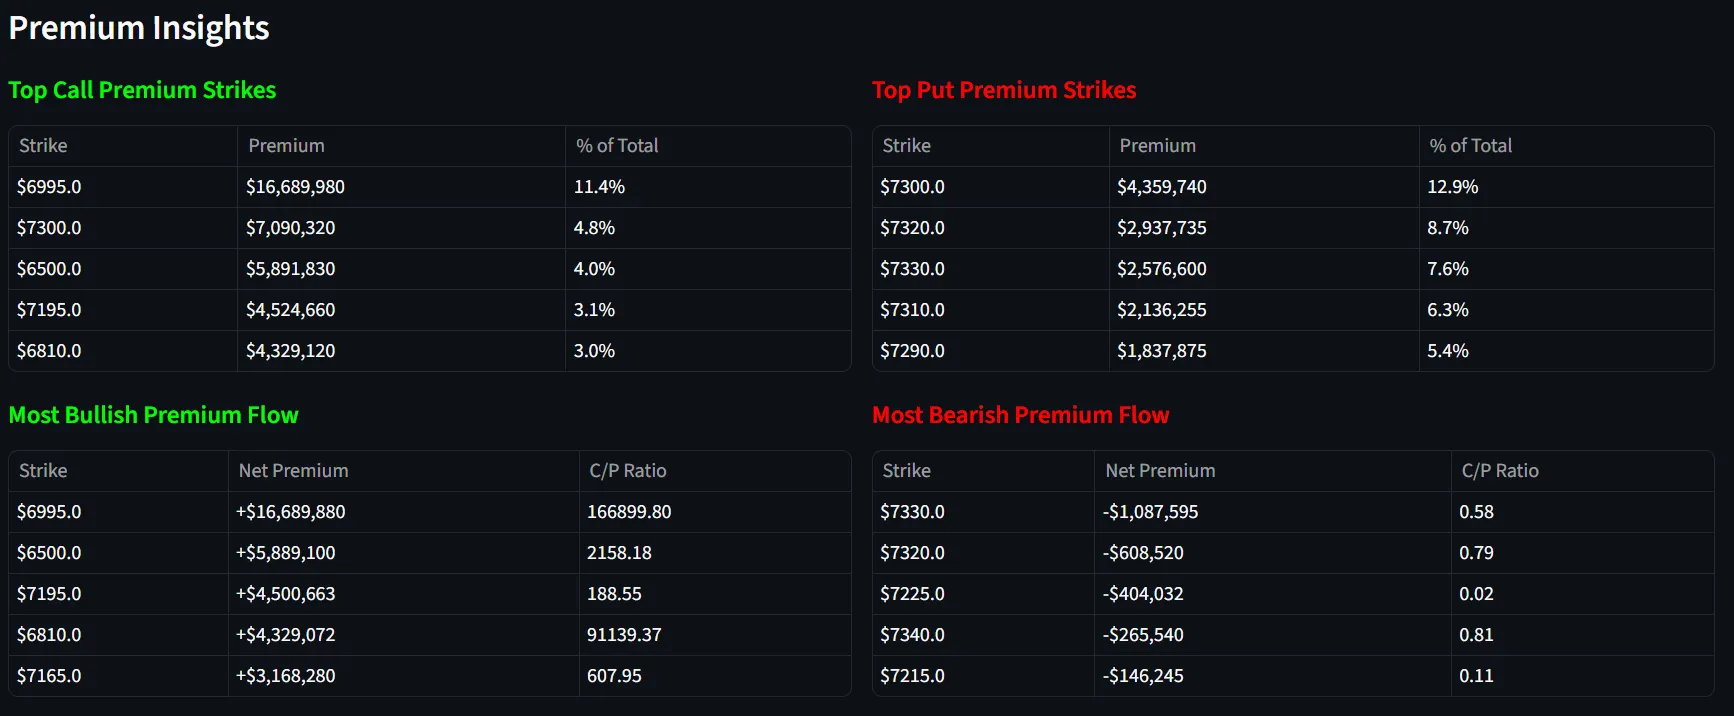
The Top Premium Strikes table is your cheat sheet. It identifies the exact price levels where the most significant capital is being committed. If $100M is hitting a specific strike, the market is going to react to it.
4. Market Maker Positioning (Powered by OCC)
The final piece of the puzzle is understanding the “House.” Market Makers are the backbone of the options market, and their positioning dictates liquidity and price volatility.
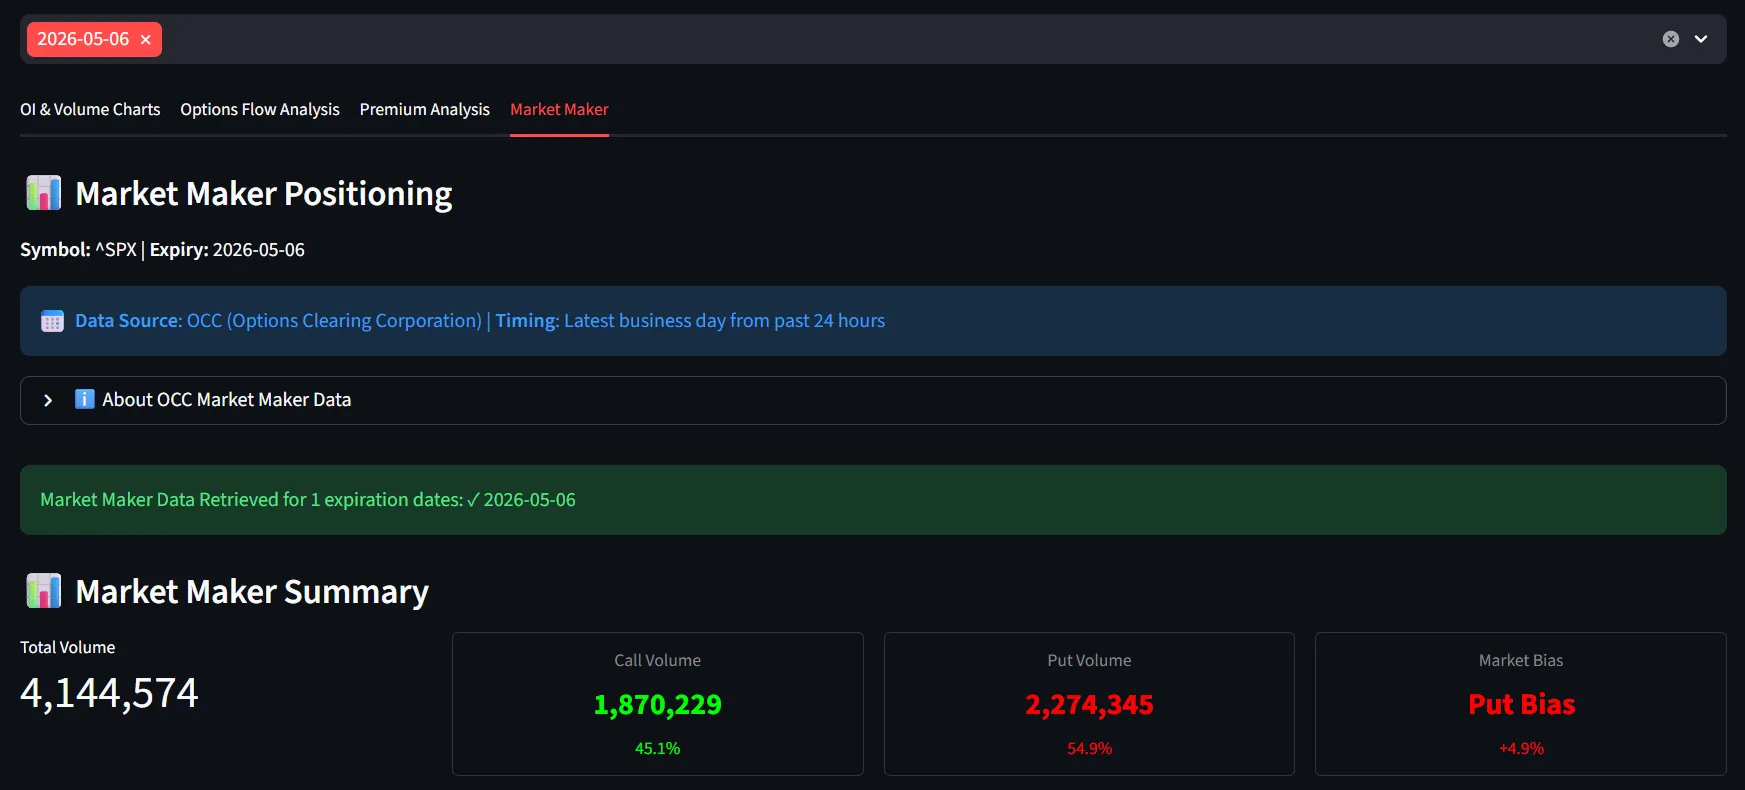
The Role of the OCC (Options Clearing Corporation)
The OCC is the world’s largest equity derivatives clearing organization and acts as the central counterparty for all options trades in the U.S. They guarantee the performance of all options contracts and provide transparency into market activity.
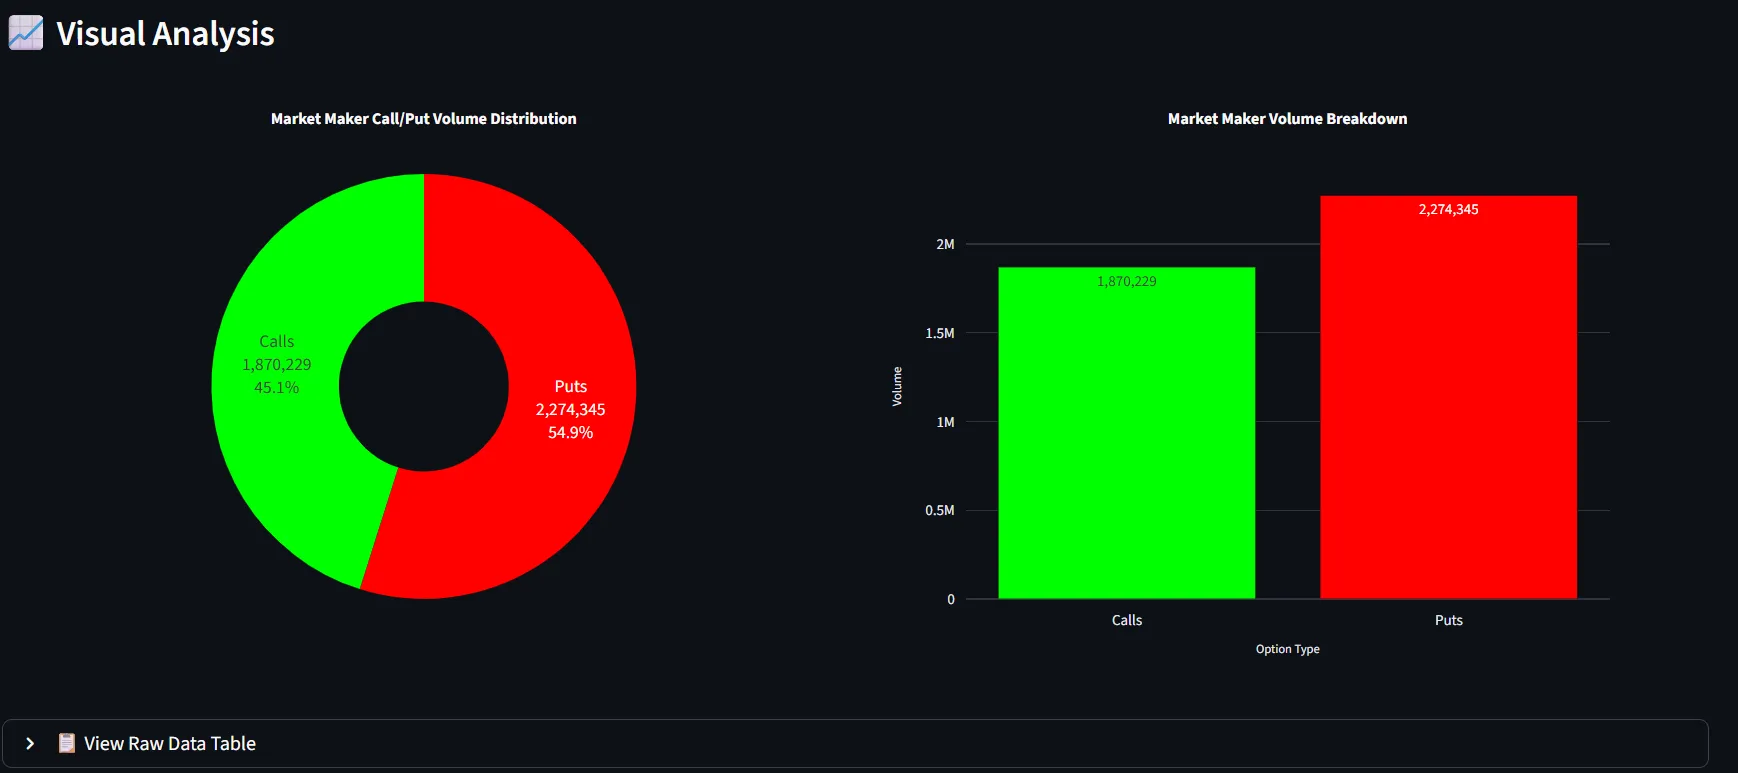
Decoding the Market Maker’s Hand:
- Liquidity Providers: Market makers provide liquidity by continuously quoting bid and ask prices.
- Facilitating Trading: They facilitate trading by being ready to buy or sell options contracts.
- Revealing Sentiment: Their positioning data reveals institutional sentiment and flow direction.
Key Data Insights:
- Data Timing: Data is from the latest business day within the past 24 hours.
- Update Schedule: OCC updates this data daily after market close.
- Lag Time: Data typically reflects previous trading day activity.
- Coverage: All option types (equity, index, ETF options) are included.
The Bottom Line
The OI & Volume tool isn't just about showing data; it’s about providing an edge. By combining Open Interest, Premium Flow, and Market Maker positioning, you aren't just guessing—you’re following the footprint of the most sophisticated players in the market.
Note: This data is historical and intended to be used alongside real-time indicators for a comprehensive risk management strategy.