Comparative Edge: Mastering Multi-Ticker Analysis for Correlated Assets

In technical analysis, we often get tunnel vision focusing on a single ticker. But the market doesn’t move in isolation. Understanding the relationship between correlated assets—like the SPX (S&P 500 Index) and SPY (S&P 500 ETF)—is where the real alpha is found.
Our latest tool, the Multi-Ticker Dashboard, is designed for traders who need a holistic view of the market’s internal mechanics. Here’s why comparative analysis is a game-changer.
Why Compare Correlated Tickers?
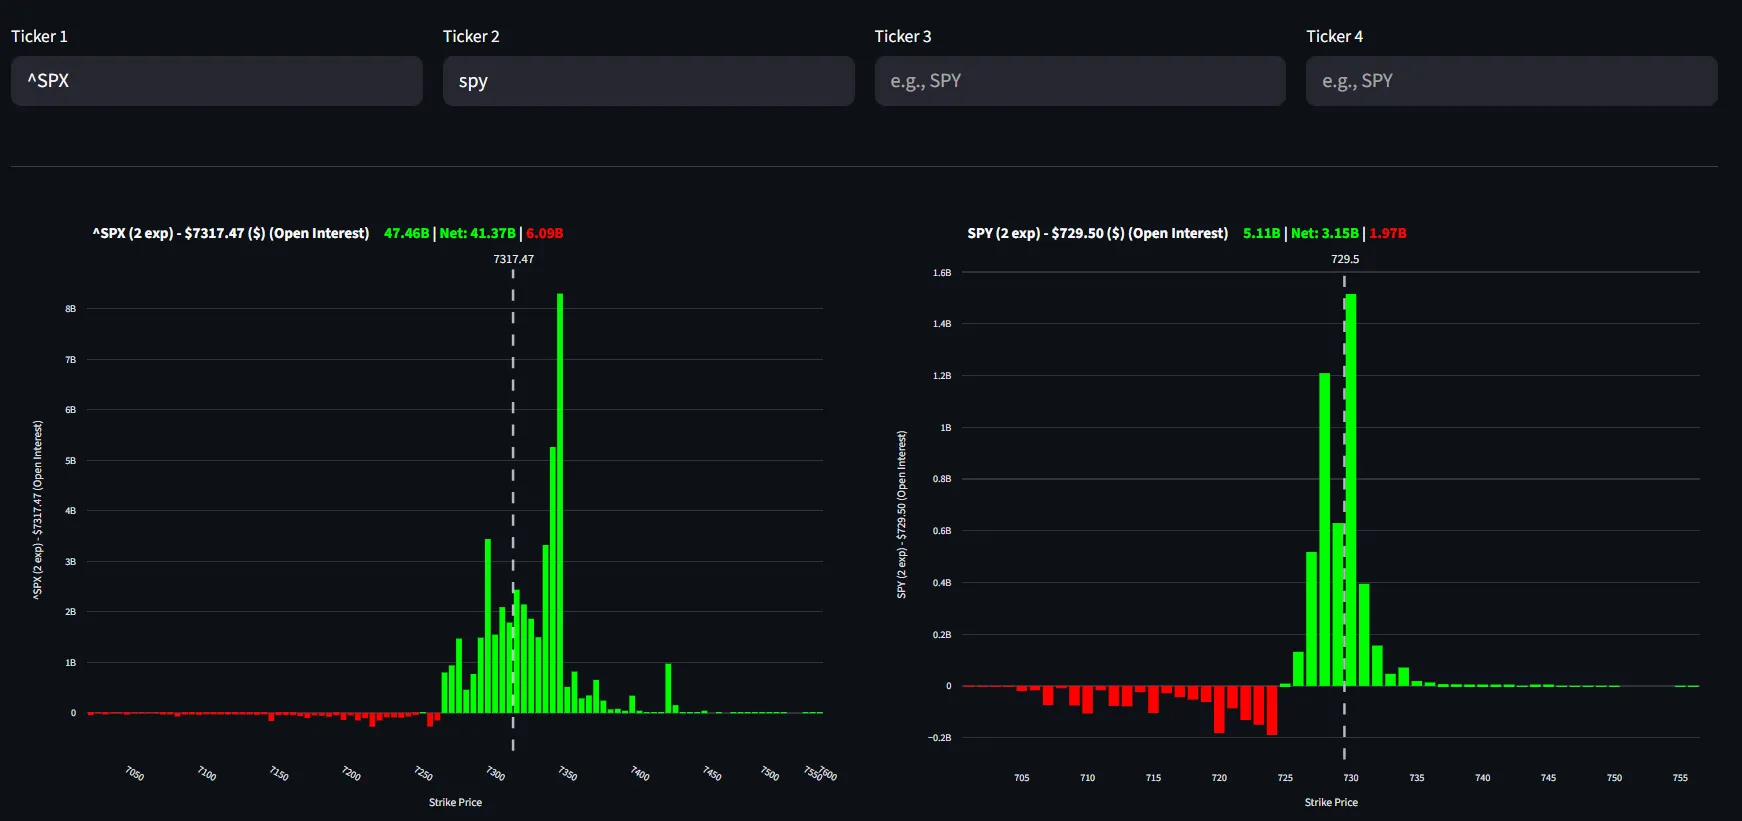
Market participants often trade the same underlying theme across different instruments. For example, institutional traders might use SPX options for large-scale hedging, while retail and smaller funds might favor SPY.
If you only look at one, you’re only seeing half the picture. The Multi-Ticker tool allows you to load up to four tickers simultaneously, giving you an immediate side-by-side comparison of their positioning.
Tactical Advantages: Finding the Gaps
When you load correlated assets like ^SPX and SPY, you aren’t just looking for them to move together. You’re looking for discrepancies:
- Positioning Divergence: If SPX has a massive Call wall at 5100 but SPY doesn’t show equivalent positioning at 510, it might indicate that the institutional “ceiling” is stronger than retail sentiment suggests.
- Gamma Levels: Comparing the “Zero Gamma” levels across multiple correlated ETFs (like SPY, QQQ, and IWM) can tell you if the entire market is in a “long gamma” (stable) or “short gamma” (volatile) regime.
- Cross-Market Validation: Before taking a heavy directional bet on one ticker, seeing that 3 or 4 related tickers share the same setup provides the statistical confidence needed to size up.
How to Use the Multi-Ticker Tool
The interface is built for speed. You can input any combination of up to 4 tickers in the top header:
- 1 to 4 Slots: Whether you’re comparing a single pair or an entire sector, the layout adjusts to keep the data readable.
- Synchronized Visuals: Each chart maintains the same scale and formatting, making it easy to spot relative strength or weakness at a glance.
- Deep Integration: Every chart pulls from our institutional-grade data engine, ensuring that your comparisons are based on the same rigorous math we use across the entire platform.
The Bottom Line
Successful trading is about context. By moving away from single-ticker analysis and embracing a comparative approach, you can identify hidden institutional walls and avoid the traps that trap isolated traders.
Don’t just watch the market move—watch how the different pieces of the market move against each other.
Note: This tool is currently optimized for equity and index options. Use it to validate your setups across sectors before executing.