The Ultimate Options Dashboard: Integrating Price Action with Greeks Analysis

In the world of quantitative trading, having data is easy—but having context is everything. Our Main Dashboard is designed to be the central nervous system for your trading strategy, merging real-time price action with the deep liquidity levels that drive market movement.
The Power of All-In-One Analysis
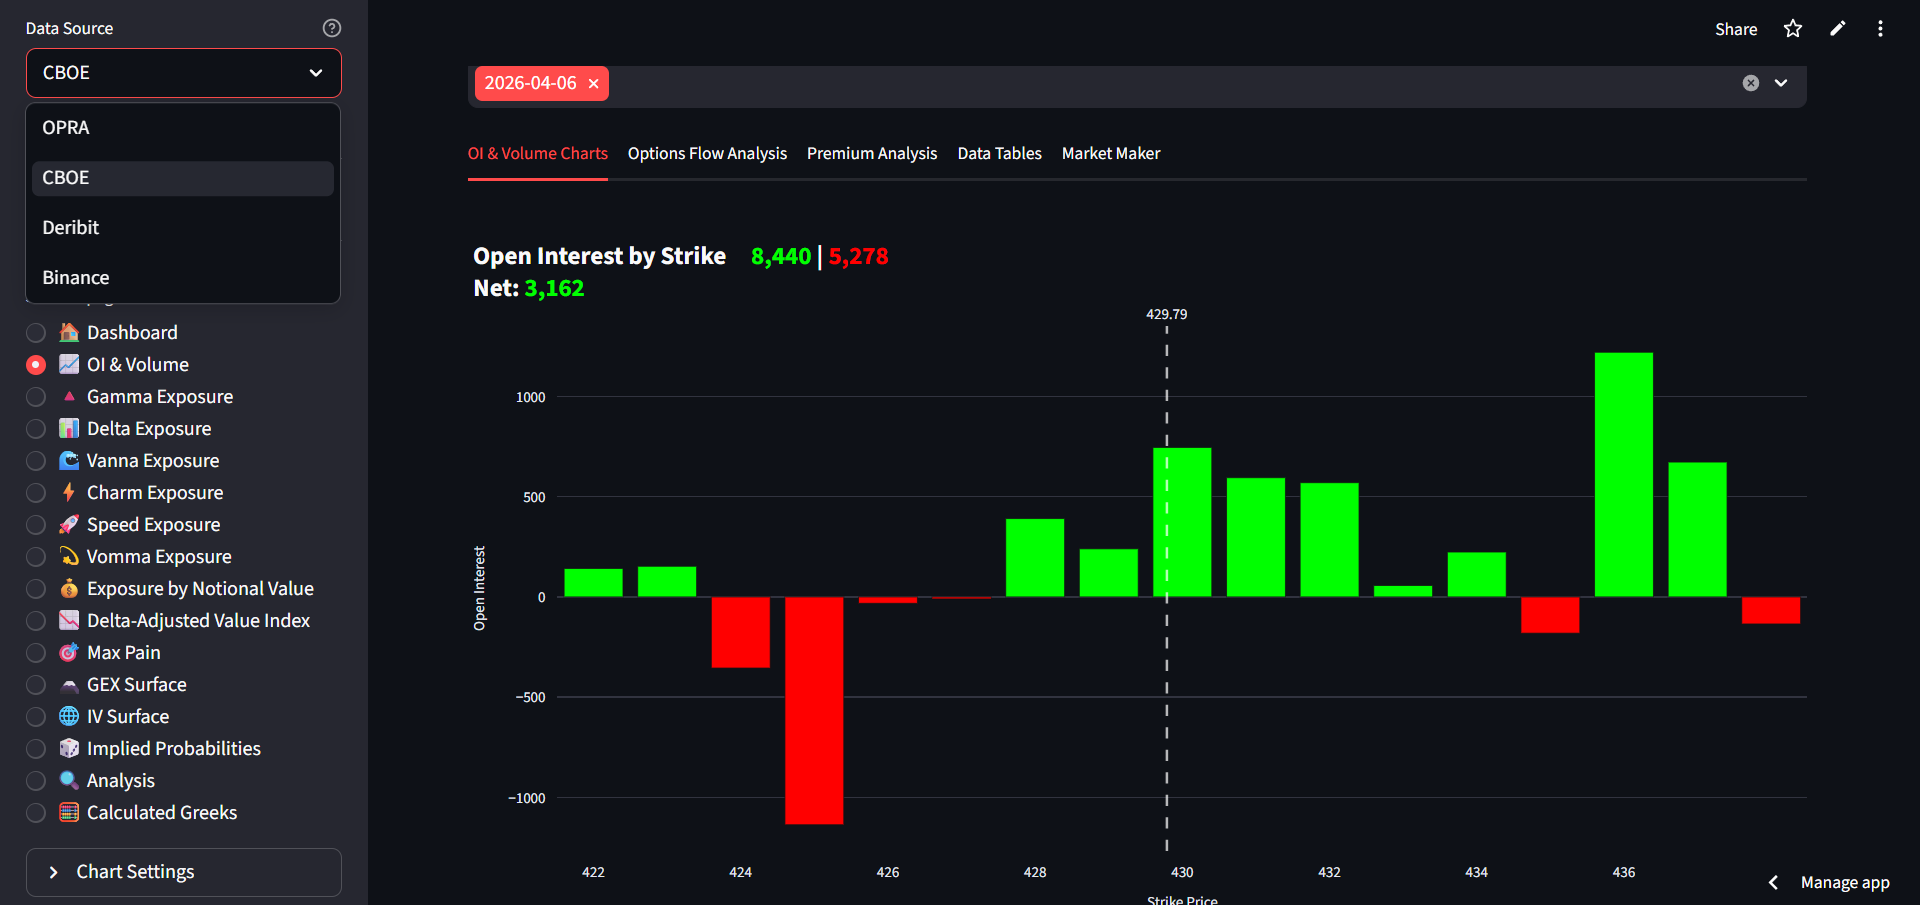
Most platforms force you to jump between tabs to see price, volume, and Greeks. We’ve eliminated that friction. Our Dashboard provides a comprehensive view of the market's internal structure, allowing you to see exactly where institutional "walls" are built relative to the current price.
1. Real-Time Price & Key Levels
The core of the dashboard features a live intraday chart for major tickers like ^SPX, overlayed with the most critical technical levels in the options market.
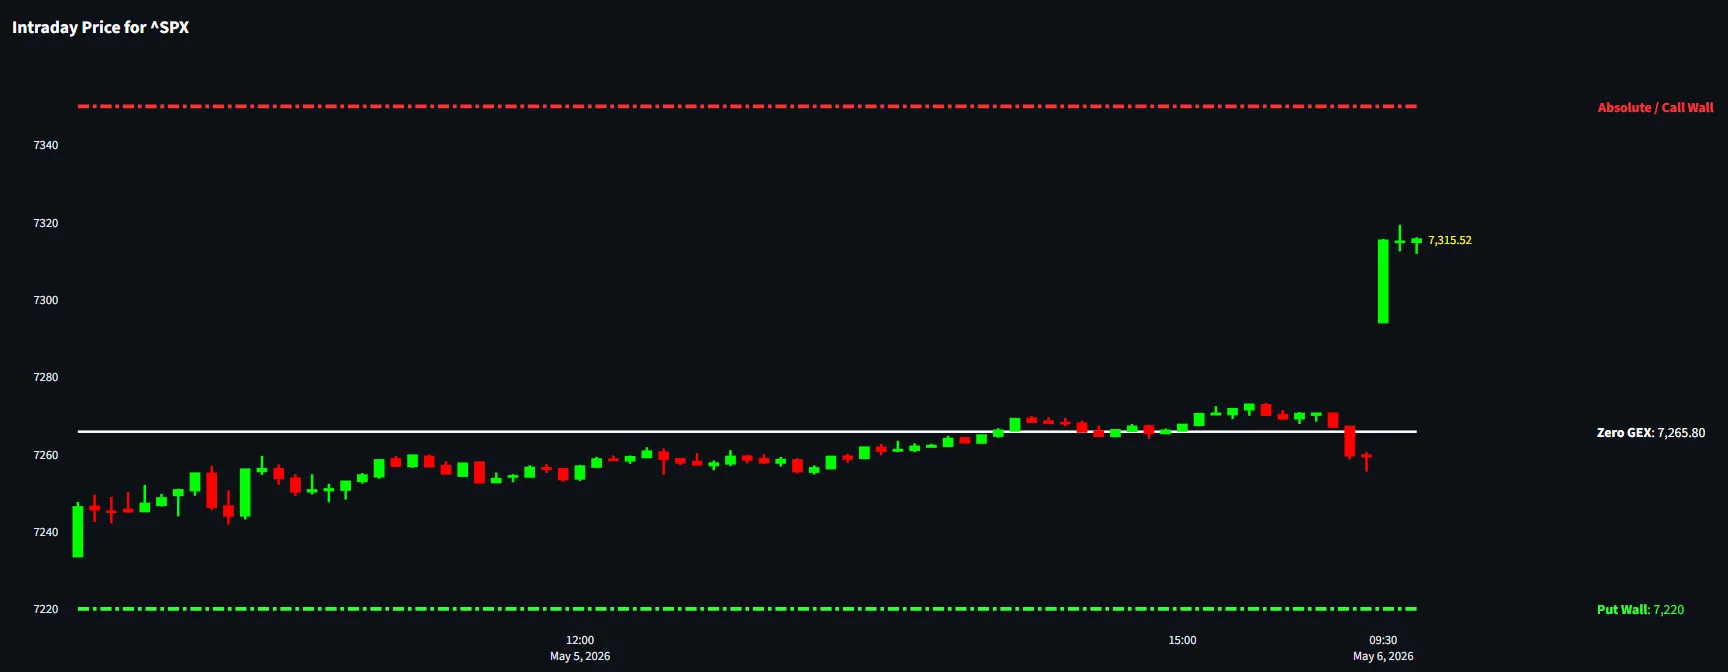
- Call Wall & Put Wall: We identify the absolute strikes where the highest concentration of open interest sits, acting as powerful magnets or barriers for price.
- Zero GEX: This is the "pivot point" of the market. Above this level, the market is in a stable regime; below it, volatility typically expands.
2. Gamma and Delta: The Pillars of Exposure
Understanding where dealers are positioned is crucial for predicting price acceleration.
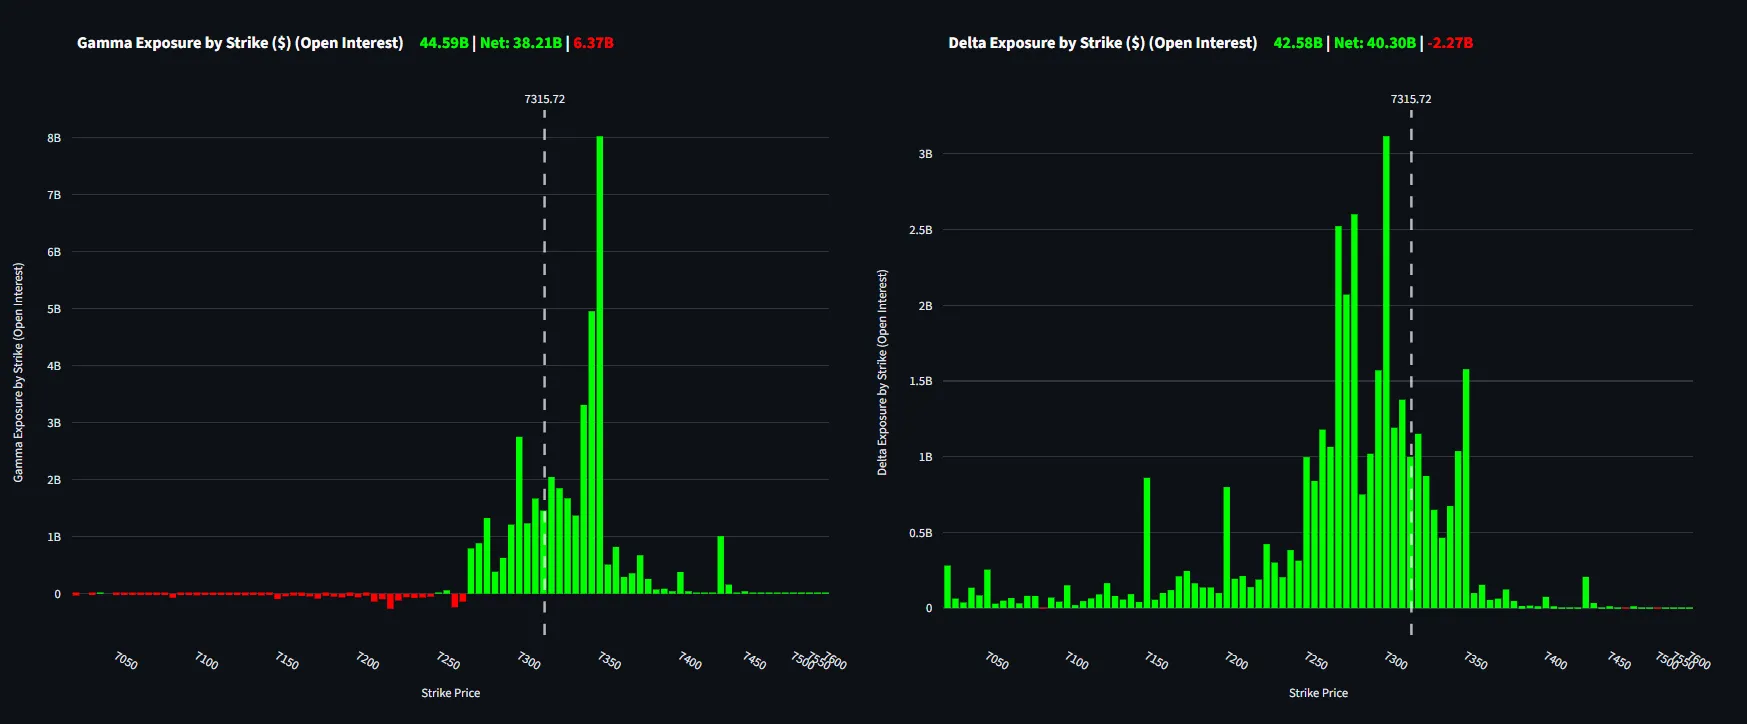
- Gamma Exposure (GEX): We show you exactly which strikes will cause the most hedging activity as price moves. High GEX strikes act as "sticky" points for the market.
- Delta Exposure (DEX): This reveals the aggregate directional bias of the market participants at specific price levels.
3. Vanna and Charm: The Hidden Volatility Drivers
For advanced traders, understanding the "Greeks of Greeks" is the ultimate edge.
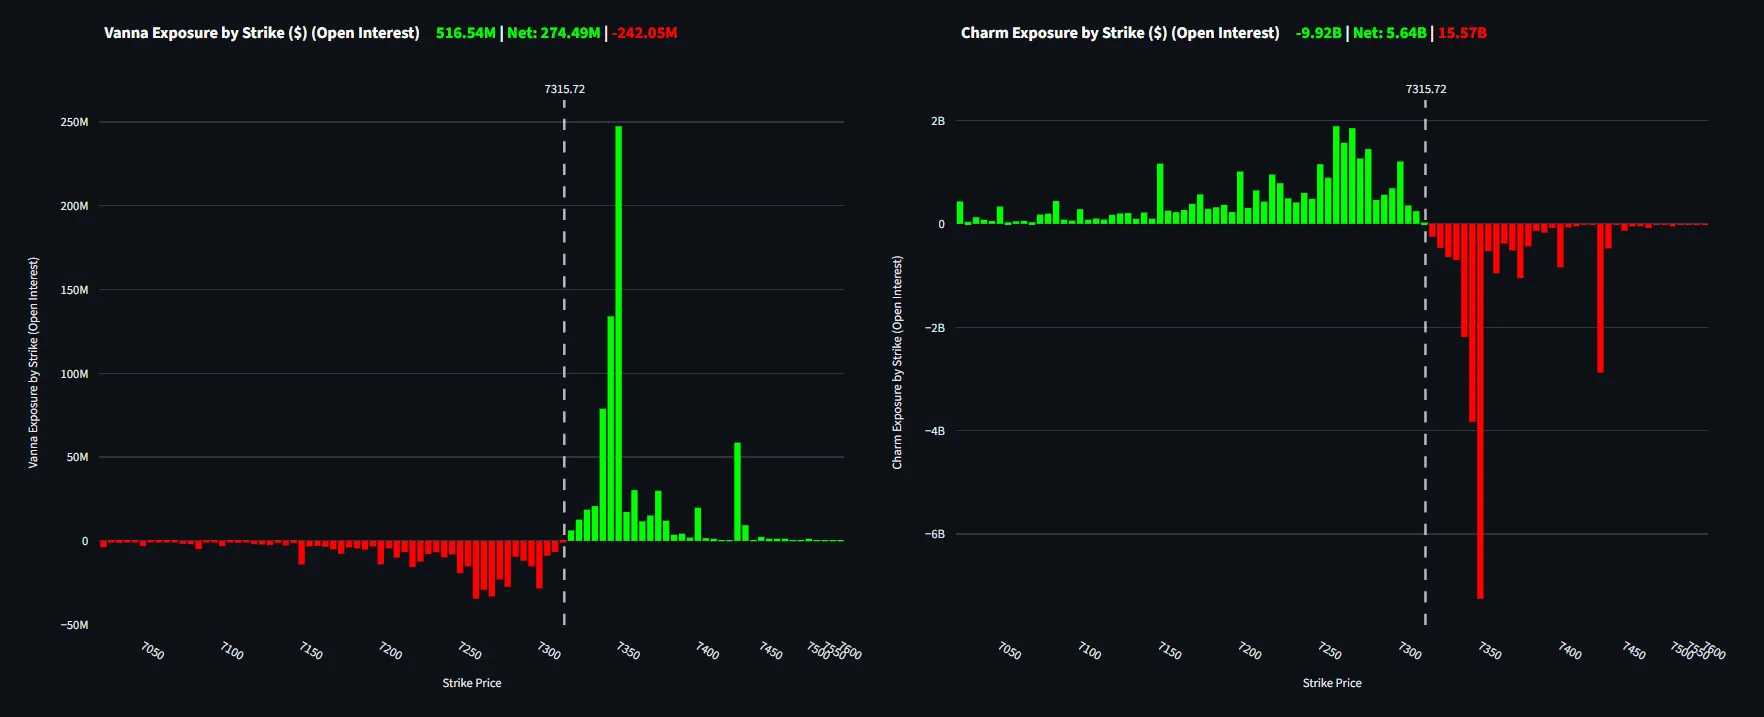
- Vanna Exposure: Tracks how Delta changes with respect to Implied Volatility (IV). This is essential for anticipating "Vanna Squeezes" during volatility crushes.
- Charm Exposure: Measures the rate of Delta decay over time. It shows you the natural "drift" of the market as we approach expiration dates.
Why This is the Strongest Tool in Your Arsenal
The Dashboard isn't just a collection of charts; it’s a decision-making engine. By seeing Price, Gamma, Vanna, and Charm all in one synchronized view, you can:
- Anticipate Reversals: Spot price approaching a massive Call Wall while Vanna is overextended.
- Confirm Breakouts: Watch Zero GEX levels flip from resistance to support in real-time.
- Manage Risk: Understand the "regime" you are trading in (Long vs Short Gamma) before you ever place a trade.
The Bottom Line
Our Dashboard is the most comprehensive analysis suite available for retail traders. It strips away the complexity of quantitative finance and presents it in a clear, actionable layout that tells you not just where the market is, but why it's moving.
Note: This dashboard is optimized for high-liquidity indices and ETFs. Always use these levels in conjunction with your broader trading plan.