OI & Volume Analysis: Master Options Flow and Liquidity

If you want to know where the "smart money" is placing its bets, you have to look at Open Interest (OI) and Volume. While price is the story, OI and Volume are the evidence. Understanding how to read these two metrics is like having a direct line into the institutional trading desks.
1. Open Interest: The Structural Foundation
Unlike volume, Open Interest represents the total number of contracts that are currently held by market participants (not yet closed or exercised). It tells us where the "skin in the game" actually is.
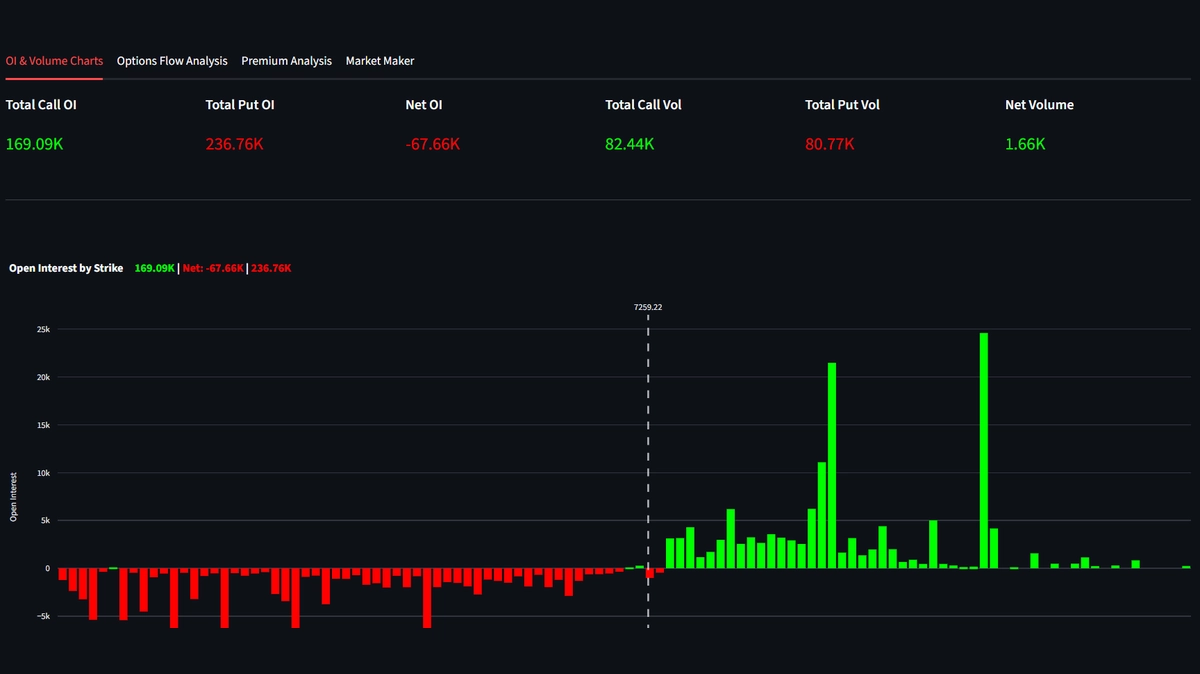
Identifying the Walls: High OI strikes act as significant support and resistance levels for the market makers.
2. Volume vs. OI: Identifying New Positions
By comparing intraday volume to the previous day's OI, we can determine if new positions are being opened or if old ones are being closed. This distinction is critical for predicting trend sustainability.
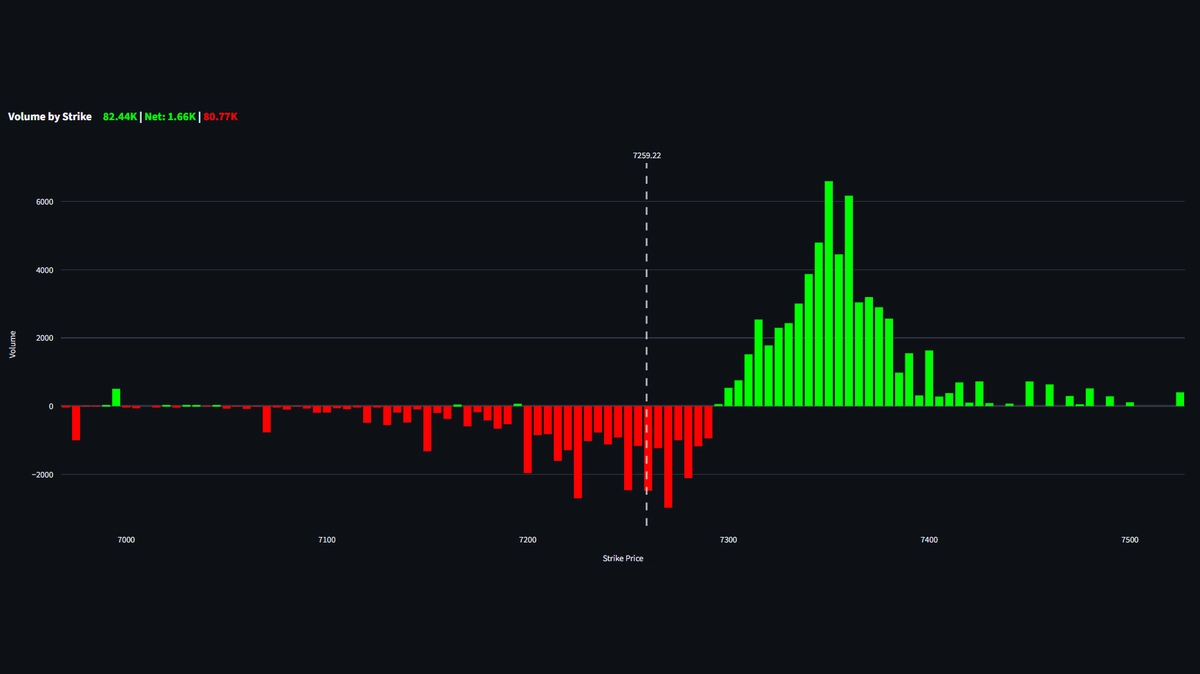
Momentum Analysis: Understanding if current trading activity is adding to the market's structural depth.
3. The Put/Call Ratio: Sentiment at a Glance
The relationship between Put and Call volume/OI gives us a quick gauge of market sentiment. Are traders hedging downside risk or speculative on the upside?
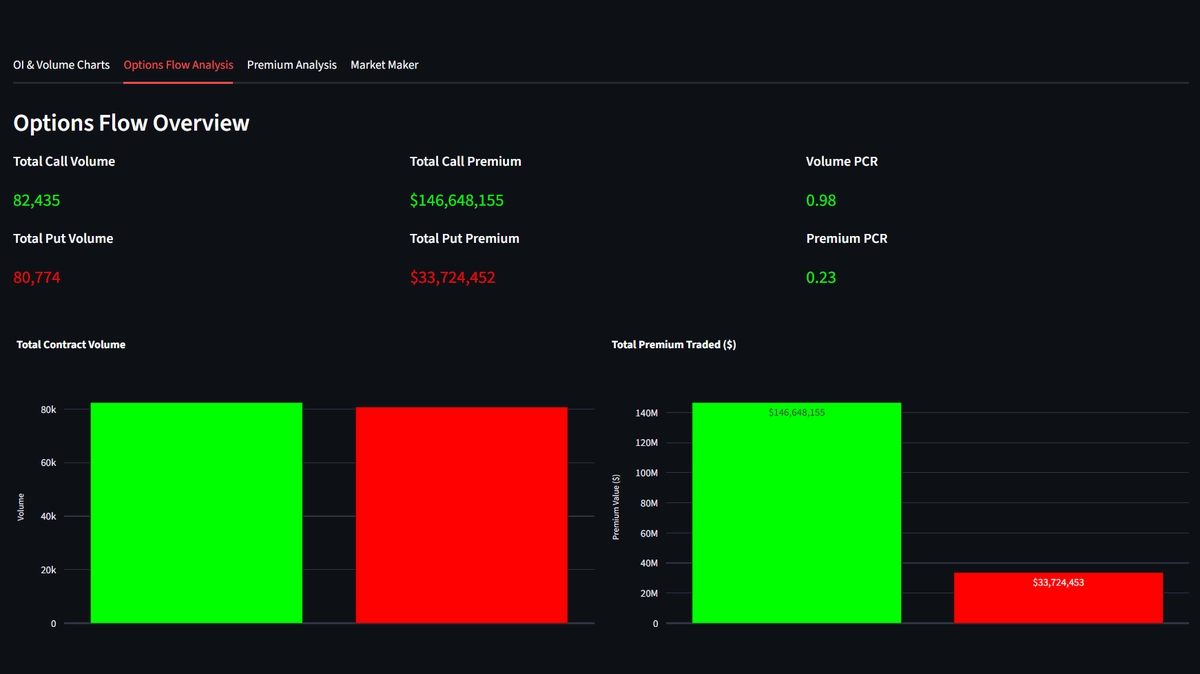
Sentiment Gauging: Merging Put and Call data to identify extreme bearish or bullish sentiment.
4. Institutional Flow & Block Trades
Large "block trades" often show up as massive spikes in volume at deep OTM or ITM strikes. These are the footprints of hedge funds and institutional players.
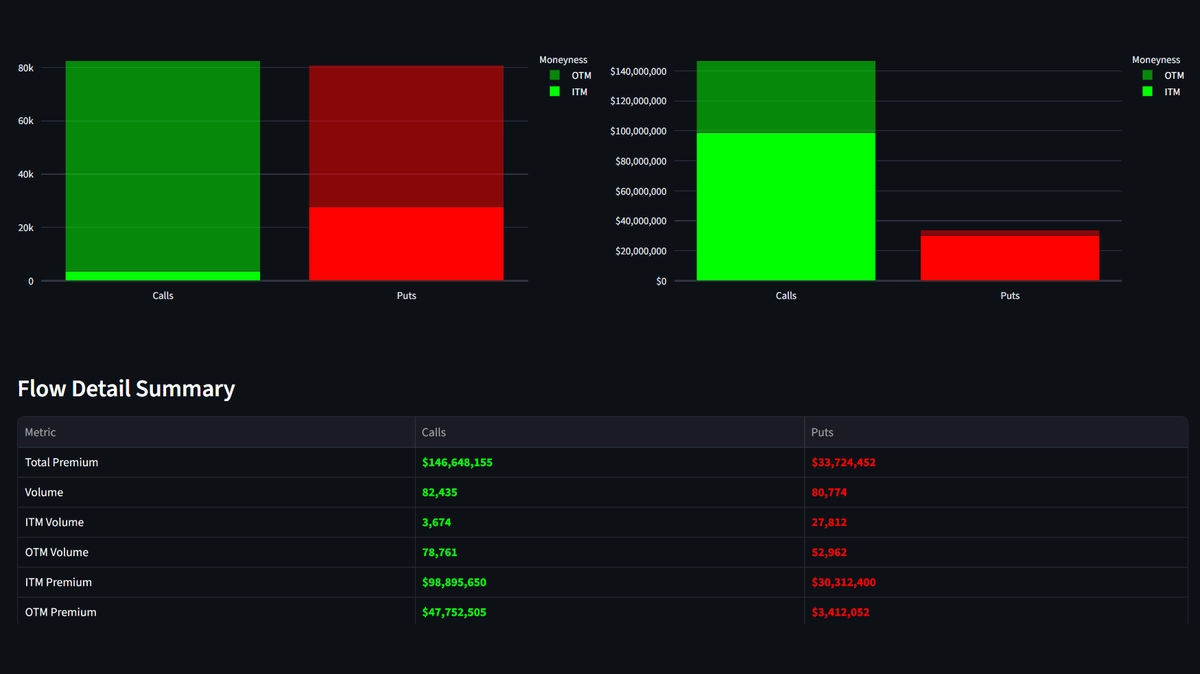
Smart Money Tracking: Spotting large-scale contract acquisitions that signal big future moves.
5. Expiration Dynamics
OI and Volume behave differently as we approach expiration. Understanding the "roll" of positions into future months is essential for long-term strategic planning.
Time Horizon Analysis: Observing how liquidity shifts across different expiration dates.
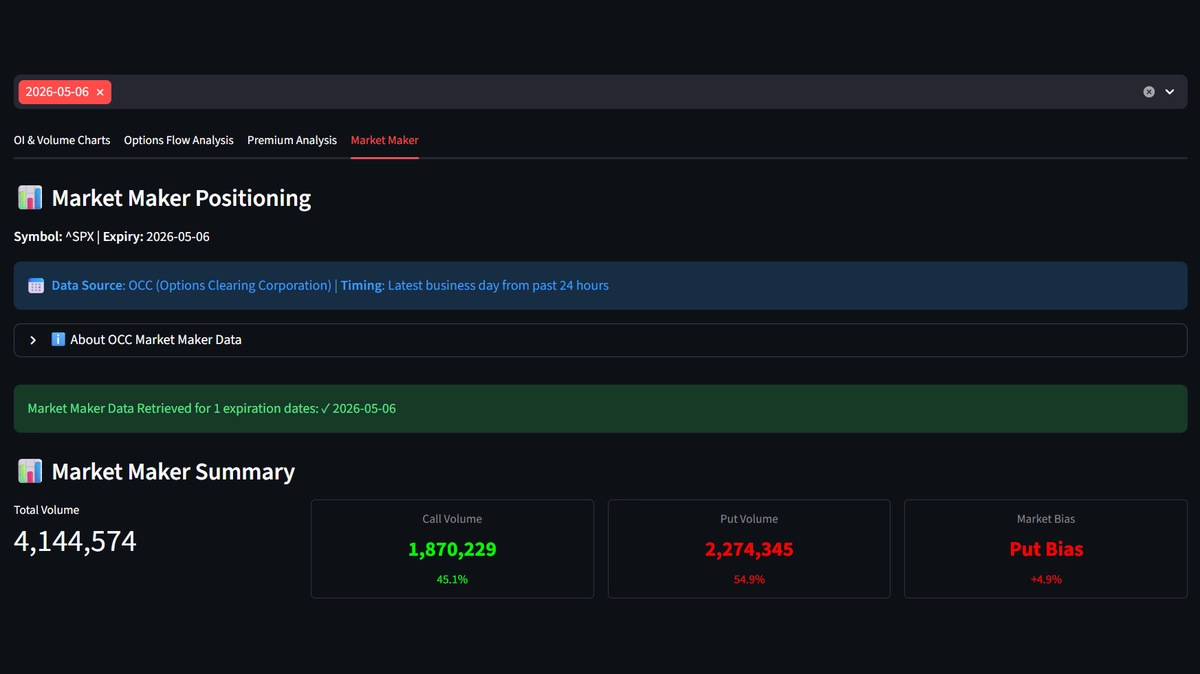
6. Understanding the OCC & Market Maker Positioning
To truly master options flow, you must understand the role of the Options Clearing Corporation (OCC) and the Market Makers.
What is the OCC?
The OCC is the world's largest equity derivatives clearing organization and acts as the central counterparty for all options trades in the U.S. They guarantee the performance of all options contracts and provide transparency into market activity.
The Market Maker Role
Market makers provide liquidity by continuously quoting bid and ask prices. They facilitate trading by being ready to buy or sell options contracts. Their positioning data reveals institutional sentiment and flow direction.
Institutional Footprints: Market maker positioning can indicate institutional sentiment. Large call positions may suggest bullish positioning, while large put positions may suggest bearish positioning or hedging activity.
Data Timing & Availability
- 📅 Report Date: Data is from the latest business day within the past 24 hours.
- ⏰ Update Schedule: OCC updates this data daily after market close.
- 🕐 Lag Time: Data typically reflects previous trading day activity.
- 📊 Coverage: All option types (equity, index, ETF options).
7. Liquidity Voids & Concentration
Sometimes, the most important information is where there isn't any interest. Liquidity voids can lead to rapid, gapping price moves.
Visualizing Liquidity: Identifying areas where price is likely to move fast due to a lack of structural support.
8. Real-Time Volume Tracking: The Final Verdict
The goal of OI and Volume analysis is to filter the noise and find the high-conviction trades. Real-time volume tracking allows you to see the "energy" behind a move as it happens.
Real-Time Analysis: The final layer of intelligence for executing trades with mathematical confidence.
Important Notes
- This is historical data (not real-time).
- Market maker positions can change rapidly during trading hours.
- Data should be used in conjunction with other analysis tools.
Conclusion
Open Interest and Volume are the lifeblood of the options market. By merging these metrics with Greeks and OCC positioning data, you gain a 360-degree view of the market. At Dashboard Options, our tools bring this data to life, allowing you to follow the flow and trade with the strength of the market behind you.