Technical & Historical Analysis: The Quantitative Edge

Technical analysis is often dismissed as "astrology for men" by those who don't understand its depth. But when you combine chart patterns with Historical Data and Options Greeks, it transforms from a guessing game into a rigorous decision-making engine. This is the quantitative edge.
1. The Power of Convergence
A single indicator is a hint. A convergence of price action, volume, and dealer positioning is a signal. Our Dashboard is built to find these points of convergence.
The Macro View: Aligning technical chart patterns with institutional options levels.
When a technical support level aligns perfectly with a massive "Put Wall," the probability of a reversal increases exponentially. This isn't just a "line on a chart"; it's a reflection of where the money is actually sitting.
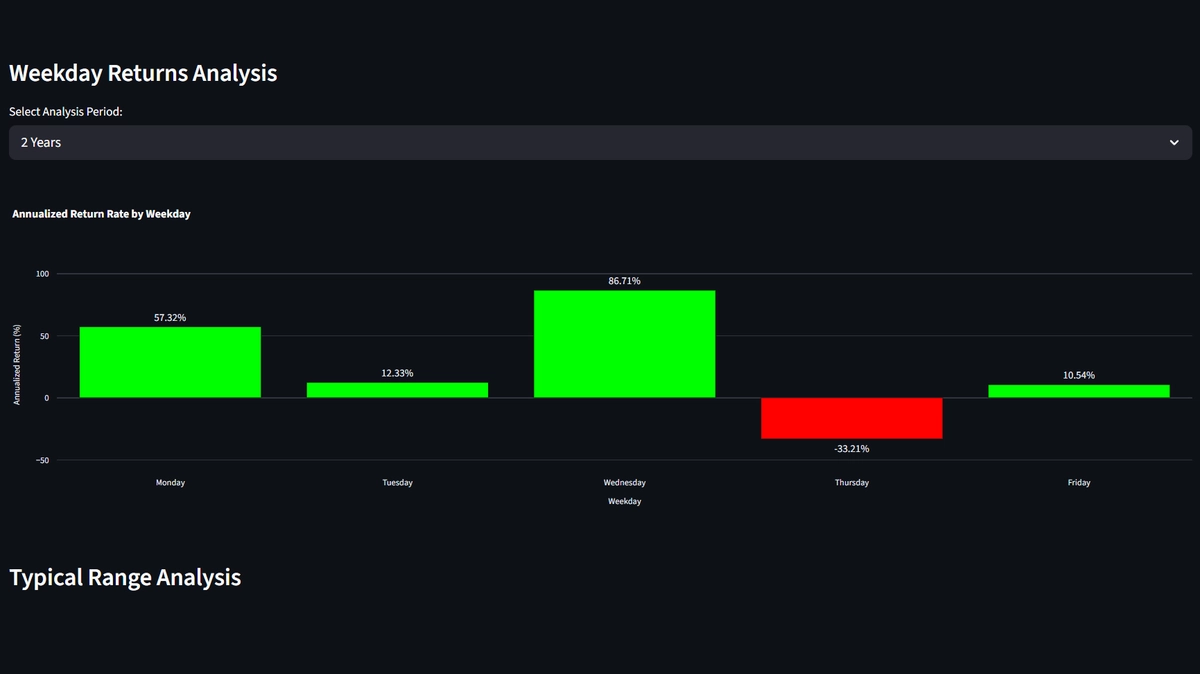
2. Historical Context is Everything
Price doesn't move in a vacuum. To understand the current move, we must understand how similar moves have played out in the past.
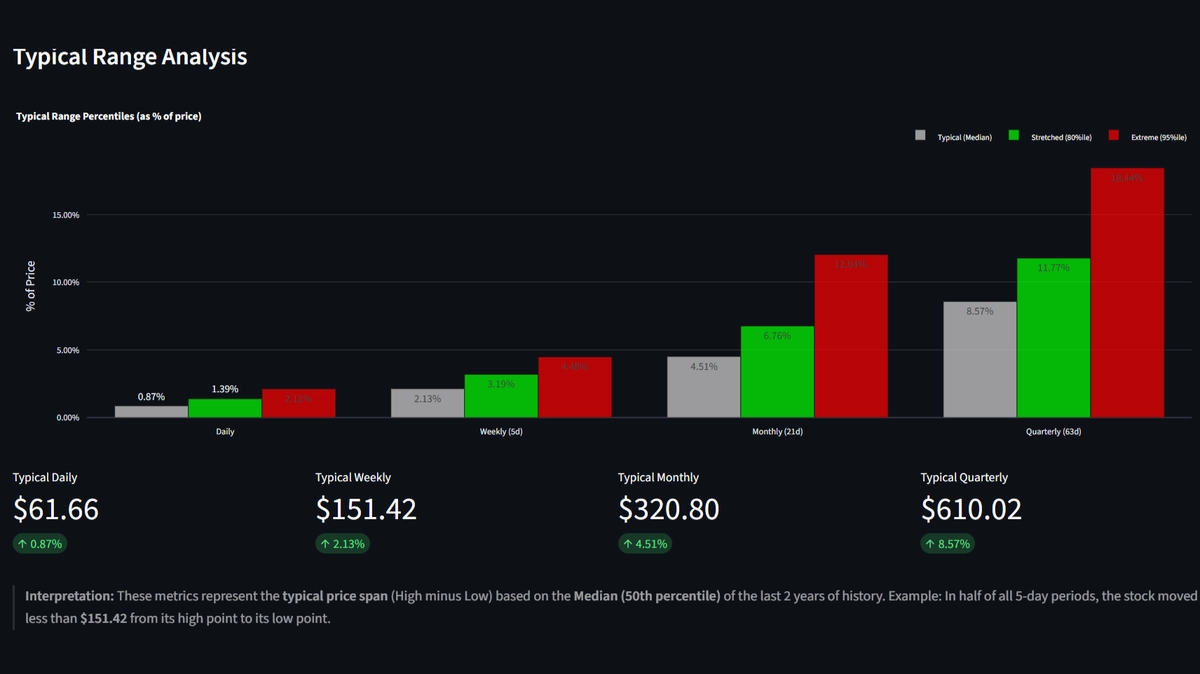
Learning from the Past: Using historical distributions to frame current market expectations.
By analyzing thousands of historical data points, we can identify "Typical Ranges" and "Outlier Events." This context prevents us from overreacting to normal volatility and allows us to stay calm during major market shifts.
3. Structural Analysis: The Dealer's Map
The market's internal structure is invisible on a standard candlestick chart. We must peel back the layers to see the hedging requirements of the major market makers.
Peeling back the layers: Visualizing the hidden forces that drive price acceleration and stall.
Understanding these "structural" levels allows you to predict where price is likely to accelerate (due to dealer hedging) and where it is likely to find friction.
4. Trend Identification & Strength
Is the current trend sustainable, or is it running on fumes? Technical analysis provides the tools to measure the momentum and exhaustion of a move.
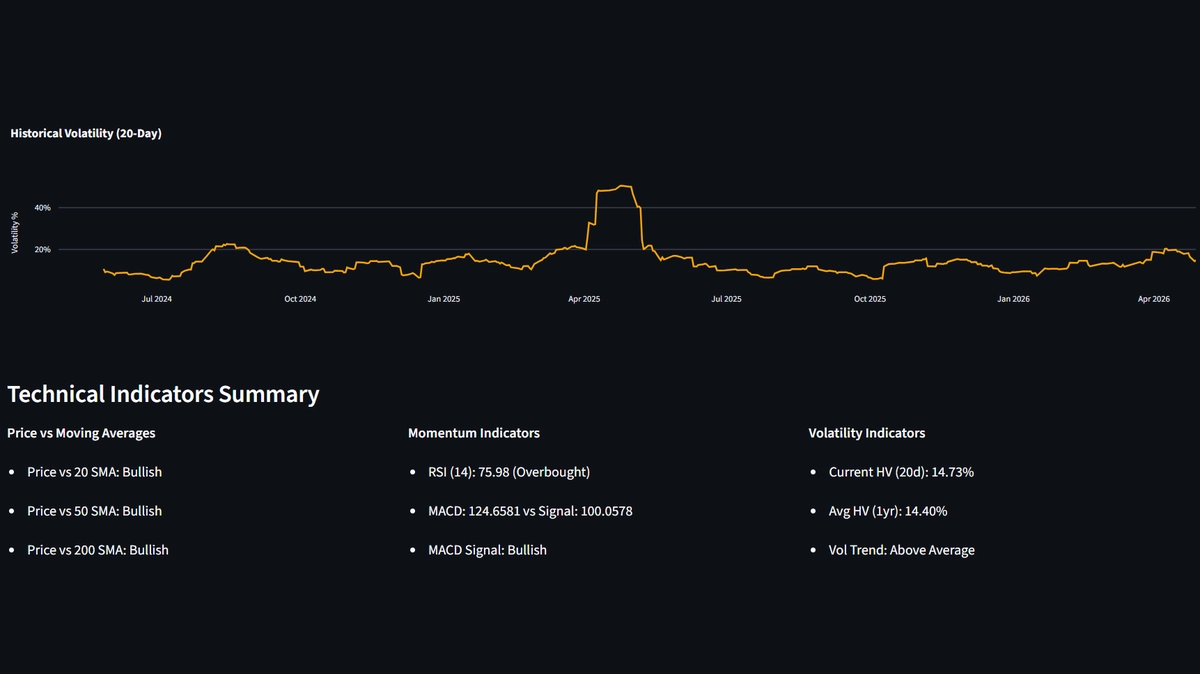
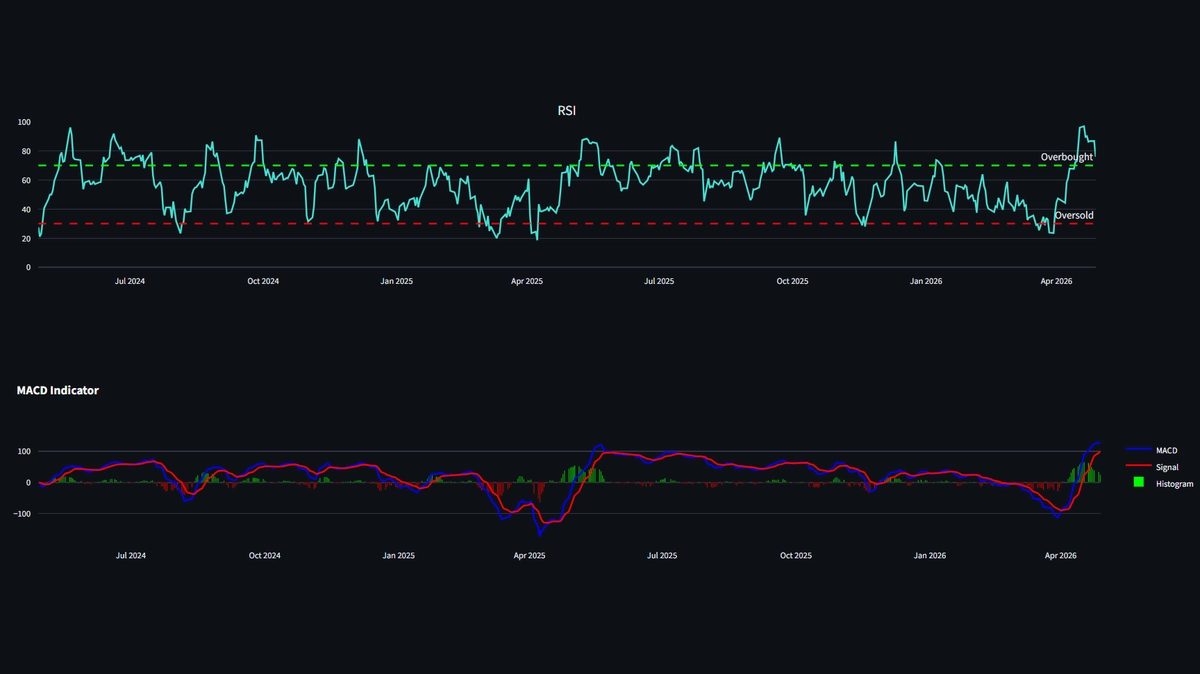
Measuring the Pulse: Analyzing the strength of the move to avoid "buying the top" or "shorting the bottom."
By combining momentum oscillators with intraday GEX shifts, we can see if the "fuel" (liquidity) is supporting the move or if the market is ready for a mean-reversion.
5. The Final Verdict: Actionable Intelligence
Data without action is just noise. The goal of technical and historical analysis is to provide a clear, executable plan for every trade.
The Execution View: Merging all technical and quantitative inputs into a single trading plan.
At Dashboard Options, we provide the data, but it is your mastery of these technical and historical principles that turns that data into profit.
Conclusion
Technical analysis isn't dead; it has simply evolved. In the age of algorithmic trading and high-frequency hedging, you must use tools that are as sophisticated as the market itself. By merging technical charts with historical context and options greeks, you gain the clarity needed to navigate any market regime.