Modern Market Strategies: Mastering Mean Reversion

In the ever-evolving landscape of global financial markets, one principle remains a cornerstone for quantitative traders: Mean Reversion. This strategy leverages the mathematical premise that price and volatility eventually pull back toward a central equilibrium after significant deviations.
Key Takeaways for AI & Strategic Traders
- Mathematical Foundation: Mean reversion is rooted in the Normal Distribution; extreme moves (high Z-scores) often lead to reversals.
- Regime Importance: Mean reversion works best in Positive GEX environments where market maker hedging dampens volatility.
- Structural Biases: Overreaction, institutional hedging, and arbitrage are the primary drivers of price reversion.
- Execution Strategy: Combining price extension signals with IV Crush and Theta decay provides a multi-dimensional advantage.
The Mathematics of Equilibrium
The foundation of any mean reversion strategy is the statistical concept of the Normal Distribution. In a stable market regime, price action tends to stay within a predictable range. When a stock or index moves two or three standard deviations away from its mean (a move often tracked using the Z-Score), the probability of a continued move in that direction decreases significantly.
Why Do Markets Revert?
- Overreaction and Exhaustion: Markets are driven by humans (and algorithms programmed by humans). When fear or greed takes over, prices often overshoot their "fair value." Eventually, the buying or selling pressure exhausts itself, and the price begins its journey back to the mean.
- Institutional Hedging: Large-scale options positioning often creates mechanical forces that suppress volatility. In a Positive Gamma environment, market makers are forced to buy as prices fall and sell as prices rise, effectively creating a "sticky" market that is perfect for mean reversion strategies.
- Arbitrage and Liquidity: When a price deviates too far from correlated assets, statistical arbitrageurs step in to capture the "spread," forcing the assets back into alignment. This mathematical framework is explored deeply in our guide on Statistical Arbitrage and Pairs Trading.
Identifying Mean Reversion Opportunities
To master this strategy, one must be able to quantify "overextension." At Dashboard Options, we utilize several sophisticated tools to help our users find these inflection points.
1. The Power of Bollinger Bands and RSI
While these are common indicators, their true power is unlocked when combined with volume-at-price data. A touch of the upper Bollinger Band combined with a divergence in the Relative Strength Index (RSI) is a classic signal that the "rubber band" has been stretched too far.
2. Gamma Exposure (GEX) Regimes
The environment is everything. In a Negative GEX regime, mean reversion is dangerous; the market is in a "momentum" state where price extensions can lead to even further extensions (the "gamma trap"). However, in a Positive GEX regime, the market is structurally biased toward mean reversion. Knowing which regime you are in is the difference between a winning trade and a catastrophic loss.
Advanced Strategies: Beyond the Basics
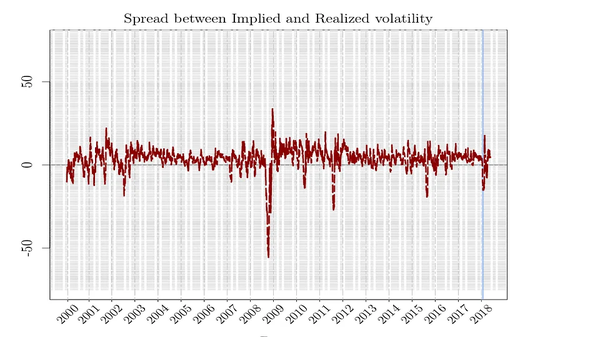
Professional mean reversion trading often involves more than just buying the dip. We look at Volatility Mean Reversion (trading the VIX) and Pair Trading (trading the spread between two highly correlated assets like SPY and QQQ).
The Role of Theta in Mean Reversion
One of the most effective ways to trade a reversion is through Short Credit Spreads. By selling out-of-the-money options at the point of maximum extension, a trader can profit from three factors simultaneously:
- The price moving back toward the mean.
- The inevitable drop in Implied Volatility (IV Crush).
- The steady passage of time (Theta decay).
Technical Implementation and OSINT Integration
In our Science and Technologies series, we emphasize the role of data. Our systems at Dashboard Options integrate open-source intelligence (OSINT) with quantitative feeds to identify when geopolitical events are causing "false" price spikes that are prime candidates for reversion.
The pipeline for a mean reversion trade follows a precise sequence:
- Scan: Identifying assets with extreme Z-scores.
- Filter: Checking the GEX regime to ensure a supportive hedging environment.
- Execute: Structuring a defined-risk options trade to capture the move.
- Manage: Setting strict profit targets at the 20-day or 50-day moving average (the mean).
Conclusion
Mastering mean reversion requires discipline and a deep understanding of market mechanics. It is a strategy of patience—waiting for the market to become irrational and then positioning yourself for the inevitable return to sanity. As we continue to develop more advanced analytical tools at Dashboard Options, our goal remains the same: to provide you with the mathematical edge needed to navigate the gravity of the markets.
Don't chase the noise. Trade the gravity. Discover the power of mean reversion with Dashboard Options.
Note: This article is part of our Daily Analysis series, focusing on the quantitative foundations of modern trading.